Environmental Information
Information on the EU Taxonomy Regulation
Background Information
As part of the European Green Deal to achieve climate neutrality in the European Union by 2050, Regulation (EU) 2020/852 of the European Parliament and of the Council of 18 June 2020 (hereinafter referred to as the EU Taxonomy) was adopted as an instrument for the classification of ecologically sustainable economic activities. The EU Taxonomy is a key element of the European Commission’s action plan to redirect capital toward a more sustainable economy. Through the Regulation, pre-defined economic activities are uniformly assessed with regard to their contribution to the European Commission’s six environmental objectives – climate change mitigation (CCM), climate change adaptation (CCA), water and marine resources (WTR), circular economy (CE), pollution prevention and control (PPC), and biodiversity and ecosystems (BIO). One target is to achieve better comparability between undertakings.
This section presents the share of Group revenue, capital expenditure (Capex), and operating expenditure (Opex) for the 2024 reporting period related to the six environmental objectives of the European Commission that are taxonomy-eligible or taxonomy-aligned in accordance with Article 8 of the Taxonomy Regulation and Article 10 of the delegated act. At Fraport the taxonomy-eligible or taxonomy-aligned economic activities contribute to the environmental objectives climate change mitigation and circular economy.
Definitions
A taxonomy-eligible economic activity means an economic activity that is described in the current delegated acts on the six environmental objectives, irrespective of whether that economic activity meets one or all of the technical screening criteria laid out in those delegated acts. Conversely, all economic activities not described in the delegated acts are not taxonomy-eligible.
A taxonomy-aligned economic activity means a taxonomy-eligible economic activity that meets the following requirements:
- The economic activity contributes clearly to one or more of the environmental objectives (substantial contribution).
- It does not significantly harm any of the other environmental objectives (Do No Significant Harm, DNSH).
- It is performed in keeping with the minimum safeguards (minimum safeguards).
| Overview taxonomy-eligible economic activities in the Fraport Group | |||
|---|---|---|---|
Environmental objective |
Economic acitivity | Activity at Fraport | Location |
| Climate change mitigation (CCM) | 4.1 Electricity generation using solar photovoltaic technology | Photovoltaic systems | Frankfurt, Bulgaria |
| Climate change mitigation (CCM) | 6.3 Urban and suburban transport, road passenger transport | Passenger Transport System (PTS) | Frankfurt |
| Climate change mitigation (CCM) | 6.17 Low carbon airport infrastructure | 400 Hz systems, PCA systems, Electric charging stations for electrical vehicles in airport operations | Frankfurt, Slovenija, Bulgaria, Greece |
| Climate change mitigation (CCM) | 6.20 Air transport ground handling operations | Baggage conveyor system, electrically operated ground vehicles | Frankfurt, Slovenija, Bulgaria |
| Climate change mitigation (CCM) | 7.3 Installation, maintenance and repair of energy efficiency equipment | LEDs | Frankfurt, Greece, Brasil |
| Climate change mitigation (CCM) | 7.5 Installation, maintenance and repair of instruments and devices for measuring, regulation and controlling energy performance of buildings | Technical centers, smart meters, facade and roofing elements with a solar shading or solar control function | Frankfurt |
| Climate change mitigation (CCM) | 7.6 Installation, maintenance and repair of renewable energy technologies | Photovoltaic systems on buildings | Frankfurt |
| Climate change mitigation (CCM) | 7.7 Acquisition and ownership of buildings 1) | Construction, renovation, and rental of buildings | Group |
| Circular Economy (CE) |
3.4 Maintenance of roads and motorways | Maintenance of aerodrome runways, taxiways and aprons | Frankfurt, Greece, Brasil, Peru, Slovenija, Bulgaria |
| 1) Economic activities 7.1 and 7.2 have been reclassified to economic activity 7.7. An explanation is given in the section “EU Taxonomy Performance Indicators.” | |||
Taxonomy-aligned Business Activities in the Fraport Group
After an examination of the substantial contribution, the DNSH criteria, and minimum safeguards requirements, the following taxonomy-aligned economic activities remain:
- 4.1 Electricity generation using solar photovoltaic technology
- 6.3 Urban and suburban transport, road passenger transport
- 6.17 Low carbon airport infrastructure
- 6.20 Air transport ground handling operations
- 7.5 Installation, maintenance, and repair of instruments and devices for measuring, regulating and controlling energy performance of buildings
- 7.6 Installation, maintenance and repair of renewable energy technologies
- 7.7 Acquisition and ownership of buildings
For the first time, economic activity 6.20 was taxonomy-aligned for the 2024 fiscal year as only taxonomy eligibility had to be reported in the previous year because of an introduction regulation. Economic activity 7.6 was new in the 2024 reporting year because of the installation of photovoltaic systems on the roofs of the parking garage and the main terminal building of Terminal 3 in Frankfurt and is also taxonomy-aligned.
Assessment of Taxonomy Alignment
Substantial Contribution to the Climate Protection Environmental Objective
The following explains the extent to which the economic activities mentioned meet the criteria for the substantial contribution.
- The free-standing photovoltaic systems, which are classified under economic activity “4.1 Electricity generation using solar photovoltaic technology,” generate electricity by means of photovoltaic technology. They are not connected to an existing building and therefore differ from the activity “7.6 Installation, maintenance and repair of renewable energy technologies.” This includes the photovoltaic system on the Runway West in Frankfurt. In addition, a photovoltaic system was built both at Varna Airport and Burgas Airport in Bulgaria in 2024.
- The passenger transport system at Frankfurt Airport comes under the economic activity “6.3 Urban and suburban transport, road passenger transport.” It makes a significant contribution according to criterion (a) as it does not cause any direct CO2 emissions. This also applies to capital expenditure in the passenger transport system in connection with the expansion of Terminal 3.
- According to letter (b), economic activity “6.17 Low carbon airport infrastructure” includes 400 Hz and PCA systems that supply aircraft with ground power and preconditioned air. In addition electrical charging stations for the airport’s own operations are classified under letter (c). In this context, a bus charging depot for electric buses was set up in Frankfurt as part of the “ResSkaLA@FRA” project, and special charging devices were installed as part of the “Fast Charging 4FRA” project, which are to be used by Lufthansa LEOS, the ground service provider of Lufthansa, for battery-electric aircraft tractors. In Greece, a total of 40 charging stations have been installed at 14 airports to charge electric ground vehicles. In addition, 400 Hz and PCA systems were purchased in Frankfurt, Slovenia, and Bulgaria.
- The electrically operated baggage conveyor system in Frankfurt falls under letter c) of the economic activity “6.20 Air transport ground handling operations” and do not cause direct CO2 emissions. In addition, this economic activity concerns electric ground vehicles at the Frankfurt, Slovenia, and Bulgaria sites of letters (a), (b), and (c).
- The exchange and modernization of technical centers (mainly in the existing Terminals 1 and 2 in Frankfurt) come under the economic activity “7.5 Installation, maintenance, and repair of instruments and devices for measuring, regulating and controlling energy performance of buildings.” The substantial contribution is met by individual action (b) “Installation, maintenance, and repair of building automation and control systems, building energy management systems, lighting control systems and energy management systems.” The installation of smart meters also falls under economic activity 7.5 letter (c), and the installation of facade and roofing elements with a solar shading or solar control function and green roofs in Terminal 3 falls under letter (d).
- The installation of photovoltaic systems on the roofs of the parking garage at Terminal 3 and of the terminal main building itself falls under the economic activity “7.6 Installation, maintenance and repair of renewable energy technologies” according to letter (a), as these are photovoltaic systems. These systems are primarily used to supply the respective buildings and are therefore directly connected to them. In contrast to economic activity 4.1, they are a permanently integrated part of the building.
- The operation of eight terminal buildings of Fraport Greece is classified under the economic activity “7.7 Acquisition and ownership of buildings.” The substantial contribution is fulfilled since the terminal buildings in question are among the top 15% of the national building stock in Greece in terms of energy efficiency. In addition, they are operated efficiently as large non-residential buildings by monitoring and evaluating energy efficiency.
No Significant Harm to the other Environmental Objectives – DNSH criteria
Avoiding significant harm to the environmental objective 2) Climate change adaptation is taken into consideration for all relevant economic activities through a climate risk and vulnerability assessment in accordance with Appendix A of Annex I on climate protection, in which the criteria for and scope of this type of analysis are defined. Various chronic and acute climate risks, which must be assessed for the sites where taxonomy-aligned activities are performed, are also specified.
To identify and analyze climate-related physical climate risks, Fraport uses the site-related climate risk data provided by Münchener Rückversicherungs-Gesellschaft AG from the “Location Risk Intelligence” analysis tool and internal workshops based on this. The scientific basis of the data is based on the IPCC emission scenarios SSP1-/RCP2.6, SSP2-/RCP4.5, SSP3-/RCP7.0, and SSP5-/RCP8.5 for the periods 2024, 2030, 2040, 2050, and 2100. For the analysis of the physical climate risks, Fraport considers only the SSP5-8.5 scenario, also known as “taking the highway.” This scenario assumes strong economic growth and intensive use of fossil fuels and predicts a rise in the global average temperature of 4.4°C by 2100.
All the climate hazards contained in Table A of Commission Delegated Regulation (EU) 2021/2139 that can be evaluated were considered. The climate risks of soil degradation and solar fluctuation are not covered by the analysis tool and were therefore analyzed and ruled out in a subsequent assessment as climate risks at the relevant sites.
The Frankfurt sites and the international operator concessions Fraport Greece, Fraport Slovenia, and Fraport Bulgaria were examined for the 2024 fiscal year. For the Frankfurt site and Fraport Slovenia, 2100 was selected as the time projection. For Fraport Greece and Fraport Bulgaria, however, a time projection was made up to the year 2050, which corresponds approximately to the end of the agreed-upon concession period. The evaluation takes into account physical climate risks that are classified as “high” or “very high” in the data scoring. No indications of material climate risks with regard to the economic activities at the sites under consideration were found. Consequently, no adaptation actions are taken or planned specifically for climate risks.
In the current version of the EU Taxonomy Regulation, it has not been defined how often the climate risk analysis needs to be updated. No annual update is carried out as time periods up to 2100 are covered in the projection scenarios. If extraordinary circumstances or substantial innovations should occur, an ad-hoc update will be executed. Regardless of the updating of the assessment, the contents of the climate risk analyses are revised in every set of annual financial statements, for example to add new aligned economic activities and adaptation actions.
The criteria for determining whether environmental target 3) Water and marine resources is affected are relevant to economic activities “6.17 Low carbon airport infrastructure,” and “6.20 Air transport ground handling operations.” The environmental impact assessments required for this purpose as well as other assessments have been approved.
The criteria for determining whether environmental target 4) Circular economy is affected are relevant to the economic activities “4.1 Electricity generation using solar photovoltaic technology,” “6.3. Urban and suburban transport, road passenger transport,” “6.17 Low carbon airport infrastructure,” and “6.20. Air transport ground handling operations.” Fraport is obligated to comply with the required waste management by European and German waste legislation, in particular in accordance with Section 6 of the German Product Recycling and Waste Management Act and the associated waste hierarchy. The relevant national and European legislation also applies in Bulgaria, Slovenia, and Greece.
The criteria for determining whether environmental target 5) Pollution is affected are relevant to the economic activities “6.3 Urban and suburban transport, road passenger transport,” “6.17 Low carbon airport infrastructure,” and “6.20 Air transport ground handling operations.” The criteria for the passenger transport system under economic activity 6.3 are irrelevant since they relate exclusively to road vehicles of class M and since the passenger transport system does not fall under this class. For the remaining economic activities, no substantial noise, vibration, dust, and pollutant emissions are caused during construction and maintenance as the actions are small and of a limited scope. The work requires only minimal intervention and is carried out in compliance with national laws in Germany, Greece, Slovenia, and Bulgaria, such as the German Noise and Vibration Occupational Health and Safety Regulation and other general occupational health and safety regulations. Annex C, which is relevant to economic activity 6.20, contains technical evaluation criteria that are relevant and must be complied with only if the economic activity corresponds to the elements described. However, since the use of the system does not involve the production, placing on the market, or use of the chemicals or other substances concerned, the technical evaluation criteria are not applicable here.
The criteria for determining whether environmental target 6) Biodiversity and ecosystems is affected are relevant to economic activities “4.1 Electricity generation using solar photovoltaic technology” and “6.17 Low carbon airport infrastructure.” These criteria are essentially based on environmental impact assessments and respect for biodiversity-sensitive areas. The environmental impact assessments required for this purpose have been approved and further site inspections have been completed.
No DNSH criteria are defined for environmental targets 3) to 6) for economic activities “7.5 Installation, maintenance, and repair of instruments and devices for measuring, regulating and controlling energy performance of buildings” and “7.6 Installation, maintenance and repair of renewable energy technologies.”
Fulfillment of Minimum Safeguards Measures
As part of the minimum safeguards, various requirements are made regarding the implementation of procedures, which are based, among other things, on the OECD Guidelines for Multinational Enterprises, and the UN Guiding Principles on Business and Human Rights as well as other regulatory initiatives. The fulfillment of the required minimum safeguards is a prerequisite for classifying an economic activity as ecologically sustainable and thus taxonomy-aligned. To implement and ensure minimum safeguards, Fraport has aligned itself with the Final Report on Minimum Safeguards from the Platform on Sustainable Finance of October 11, 2022. The main focus of this report was on human rights, corruption and bribery, taxation, and fair competition.
In assessing compliance with the minimum safeguards, we examined whether adequate processes were implemented for each of the above topics to avoid negative impacts. Furthermore, the results of the respective measures taken are examined on an ongoing basis to determine whether the measures taken are effective in preventing negative impacts. The assessment showed that all criteria were met.
For the actions that Fraport has implemented in the areas of human rights and corruption & bribery, please refer to the information about the disclosure requirements for ESRS S1 Own workforce, ESRS S3 Affected communities, and G1 Business conduct.
In the thematic field of “Taxation”, Fraport is subject to the country-specific tax laws and regulations, the implementation of and compliance with which is monitored and ensured by the Tax department and external and internal audits. Regular compliance risk analyses and employee training are carried out in the areas of antitrust and competition law.
EU Taxonomy Performance Indicators
Starting in the 2024 fiscal year, economic activities “7.1 Construction of new buildings” and “7.2 Renovation of existing buildings” will be reclassified to economic activity “7.7 Acquisition and ownership of buildings.” This conversion is carried out in accordance with the requirements of the EU Taxonomy in order to ensure a more appropriate allocation of economic activities in the real estate sector. No figures or the underlying accounting logic are changed; only the allocation of the activities is adjusted. The adjustment applies to all performance indicators.
To avoid any double counting when allocating the revenue and Capex and Opex KPIs in the numerator across the economic activities, a clear and unambiguous allocation method has been implemented that ensures that each economic activity is only recorded once.
Revenue KPI
The share of taxonomy-eligible Group revenue was calculated as the portion of the net revenue from products and services related to taxonomy-eligible economic activities (numerator), divided by net revenue (denominator; the denominator corresponds to the Group revenue; see also Group Notes, note 5).
Fraport generates revenue from products and services associated with taxonomy-eligible economic activities in the area of renting. This concerns the activity “7.7 Acquisition and ownership of buildings”. Revenue from the renting of buildings is mainly reflected in the revenue in the Retail & Real Estate and International Activities & Services segments. Furthermore, Fraport obtains taxonomy-eligible revenue by providing the passenger transport system. This comes under the economic activity “6.3 Urban and suburban transport, road passenger transport”. The related costs are passed on to airlines within the airport charges of the Aviation segment. To determine the taxonomy-eligible portion, a distribution formula was applied based on the cost basis to ensure appropriate allocation to the charges. In addition, Fraport generates taxonomy-eligible revenue through economic activity “6.20 Air transport ground handling operations,” both at the Frankfurt site and at foreign airports. Analogous to the calculation system for economic activity 6.3, a distribution key is determined in order to ensure proper settlement of charges.
The taxonomy-aligned revenue of the passenger transport system of economic activity 6.3 increased to €47.45 million, mainly caused by the higher passenger volume (previous year: €37.09 million). In addition, revenue from the rental at Fraport Greece is taxonomy-aligned in the amount of €66.85 million (previous year: €58.15 million). In this reporting year, taxonomy-aligned revenue of €149.68 million was added to taxonomy-aligned revenue in connection with economic activity “ 6.20 Air transport ground handling operations.”
Taxonomy-eligible but non-taxonomy-aligned revenue is described in the following section. With regard to the renting of buildings (7.7), an increase in the taxonomy-eligible revenue to €759.53 million is recorded (previous year: €650.08 million). Revenue from economic activity 6.20 comprises an amount of €679.92 million (previous year: €752.54 million).
| Proportion of turnover / Total turnover | ||
|---|---|---|
| Taxonomy-aligned per objective | Taxonomy-eligible per objective | |
| Climate Change Mitigation (CCM) | 5.96% | 38.48% |
| Climate Change Adaptation (CCA) | 0.00% | 0.00% |
| Water and marine resources (WTR) | 0.00% | 0.00% |
| Circular Economy (CE) | 0.00% | 0.00% |
| Pollution (PPC) | 0.00% | 0.00% |
| Biodiversity and ecosystems (BIO) | 0.00% | 0.00% |
| Template turnover | |||||||||||||||||||
|---|---|---|---|---|---|---|---|---|---|---|---|---|---|---|---|---|---|---|---|
| Substantial contribution criteria | DNSH criteria (Does Not Significantly Harm) | ||||||||||||||||||
| Economic activities | Code(s) | Turnover | Proportion of turnover 2024 | Climate change mitigation |
Climate change adaptation |
Water | Pollution | Circular Economy |
Biodiversity | Climate change Mitigation |
Climate change adaptation |
Water | Pollution | Circular Economy |
Biodiversity | Minimum Safeguards |
Proportion of Taxonomy-aligned (A.1.) or -eligible (A.2.) turnover 2023 | Category enabling activity |
Category transitional activity |
| (1) | (2) | (3) | (4) | (5) | (6) | (7) | (8) | (9) | (10) | (11) | (12) | (13) | (14) | (15) | (16) | (17) | (18) | (19) | (20) |
| € mil. | % | Y; N; N/EL | Y; N; N/EL | Y; N; N/EL | Y; N; N/EL | Y; N; N/EL | Y; N; N/EL | Y/N | Y/N | Y/N | Y/N | Y/N | Y/N | Y/N | % | E | T | ||
| A. TAXONOMY-ELIGIBLE ACTIVITIES | |||||||||||||||||||
| A.1. Environmentally sustainable activities (Taxonomy-aligned) | |||||||||||||||||||
| Urban and suburban transport, road passenger transport |
CCM 6.3 | 47.45 | 1.07 | Y | N/EL | N/EL | N/EL | N/EL | N/EL | Y | Y | Y | Y | Y | Y | Y | 0.93 | ||
| Air transport ground handling operations | CCM 6.20 | 149.68 | 3.38 | Y | N/EL | N/EL | N/EL | N/EL | N/EL | Y | Y | Y | Y | Y | Y | Y | 0.00 | ||
| Acquisition and ownership of buildings | CCM 7.7 | 66.85 | 1.51 | Y | N/EL | N/EL | N/EL | N/EL | N/EL | Y | Y | Y | Y | Y | Y | Y | 1.45 | ||
| Turnover of environmentally sustainable activities (Taxonomy-aligned) (A.1) | 263.98 | 5.96 | 5.96% | 0% | 0% | 0% | 0% | 0% | 2.38 | ||||||||||
| Of which enabling | 0.00 | 0.00 | 0.00% | 0% | 0% | 0% | 0% | 0% | E | ||||||||||
| Of which transitional | 0.00 | 0.00 | 0.00% | T | |||||||||||||||
| A.2. Taxonomy-Eligible but not environmentally sustainable activities (not Taxonomy-aligned activities) |
|||||||||||||||||||
| EL; N/EL | EL; N/EL | EL; N/EL | EL; N/EL | EL; N/EL | EL; N/EL | ||||||||||||||
| Air transport ground handling operations | CCM 6.20 | 679.92 | 15.36 | EL | N/EL | N/EL | N/EL | N/EL | N/EL | 18.81 | |||||||||
| Acquisition and ownership of buildings | CCM 7.7 | 759.53 | 17.16 | EL | N/EL | N/EL | N/EL | N/EL | N/EL | 16.25 | |||||||||
| Turnover of Taxonomy-eligible but not environmentally sustainable activities (not Taxonomy-aligned activities) (A.2) | 1,439.45 | 32.52 | 32.52% | 0% | 0% | 0% | 0% | 0% | 35.06 | ||||||||||
| A. Turnover of Taxonomy-eligible activities (A.1+A.2) |
1,703.44 | 38.48 | 38.48% | 0% | 0% | 0% | 0% | 0% | 37.44 | ||||||||||
| B. TAXONOMY-NON-ELIGIBLE ACTIVITIES | |||||||||||||||||||
| Turnover of Taxonomy-non-eligible activities |
2,723.55 | 61.52 | 62.56 | ||||||||||||||||
| Total (A+B) | 4,426.98 | 100.00 | 100.00 | ||||||||||||||||
Capital Expenditure (Capex) KPI
The Capex KPI, which indicates the proportion of taxonomy-eligible capital expenditure, is defined as the ratio of capital expenditure eligible under the EU Taxonomy Regulation (numerator) divided by the total capital expenditure (denominator).
Total capital expenditure includes additions to property, plant, and equipment and intangible assets during the fiscal year. This includes the additions to property, plant, and equipment (IAS 16), intangible assets (IAS 38), rights of use (IFRS 16), and investment property (IAS 40). The total additions can be found in the section “Additions to non-current assets” and in the Consolidated Statement of Changes in Non-current Assets.
At Fraport the numerator consists of the following categories for taxonomy-eligible capital expenditure:
- Capital expenditure relating to assets or processes associated with taxonomy-eligible economic activities (letter a) of Annex I to the delegated act pursuant to Article 8 of the Delegated Regulation (EU) 2021/2178 plus
- Capital expenditure relating to individual actions enabling the target activities to become low-carbon or to lead to greenhouse gas reductions (letter c) of Annex I to the delegated act pursuant to Article 8 of the Delegated Regulation (EU) 2021/2178
Capital expenditure related to assets or processes associated with taxonomy-eligible economic activities (letter (a)) are to be allocated in particular to the economic activity “6.3 Urban and suburban passenger transport, passenger road transport”. Given that the economic activity and the operation of the passenger transport system cannot be carried out without the corresponding rail infrastructure or stations, Fraport considers the related capital expenditure to be connected with economic activity 6.3.
All taxonomy-eligible and taxonomy-aligned additions are to be attributed to investments in infrastructure and terminal buildings.
The taxonomy-aligned additions for the passenger transport system of economic activity 6.3 increased compared to the previous year to €132.68 million (previous year: €97.71 million). Another taxonomy-aligned addition concerns economic activity “7.5 Installation, maintenance and repair of instruments and devices for measuring, regulation and controlling energy performance of buildings” with €44.97 million (previous year: €27.51 million). For economic activity “6.17 Low carbon airport infrastructure,” the taxonomy-aligned additions amounted to €6.57 million (previous year: €1.67 million). Economic activity “6.20 Air transport ground handling operations” shows taxonomy-aligned additions of €50.16 million, a substantial portion of which relates to the baggage conveyor system in Terminal 3.
The amounts described in the following section are taxonomy-eligible but are non-taxonomy-aligned capital expenditure. This year, because of the reclassification in connection with the economic activities in the real estate sector, taxonomy-eligible capital expenditure amounting to €1,196.83 million (in the previous year a total of: €963.92 million) is recognized under “7.7 Acquisition and ownership of buildings” instead of “7.1 Construction of new buildings” and “7.2 Renovation of existing buildings” for the first time. Additions to economic activity “3.4 Maintenance of roads and motorways” amounted to €41.65 million (previous year: €14.97 million).
| Proportion of capital expenditures / Total capital expenditures | ||
|---|---|---|
| Taxonomy-aligned per objective | Taxonomy-eligible per objective | |
| Climate Change Mitigation (CCM) | 13.56% | 79.25% |
| Climate Change Adaptation (CCA) | 0.00% | 0.00% |
| Water and marine resources (WTR) | 0.00% | 0.00% |
| Circular Economy (CE) | 0.00% | 2.26% |
| Pollution (PPC) | 0.00% | 0.00% |
| Biodiversity and ecosystems (BIO) | 0.00% | 0.00% |
| Template capital expenditures (Capex) | |||||||||||||||||||
|---|---|---|---|---|---|---|---|---|---|---|---|---|---|---|---|---|---|---|---|
| Substantial contribution criteria | DNSH criteria (Does Not Significantly Harm) | ||||||||||||||||||
| Economic activities | Code(s) | Absolute Capex | Proportion of Capex 2024 | Climate change mitigation |
Climate change mitigation |
Climate change adaptation |
Water | Pollution | Circular Economy |
Climate change mitigation |
Climate change adaptation |
Water | Pollution | Circular Economy |
Biodiversity | Minimum Safeguards |
Proportion of Taxonomy-aligned (A.1.) or -eligible (A.2.) Capex 2023 | Category enabling activity |
Category transitional activity |
| (1) | (2) | (3) | (4) | (5) | (11) | (12) | (13) | (14) | (15) | (11) | (12) | (13) | (14) | (15) | (16) | (17) | (18) | (19) | (20) |
| € mil. | % | Y; N; N/EL | Y/N | Y/N | Y/N | Y/N | Y/N | Y/N | Y/N | Y/N | Y/N | Y/N | Y/N | Y/N | % | E | T | ||
| A. TAXONOMY-ELIGIBLE ACTIVITIES | |||||||||||||||||||
| A.1. Environmentally sustainable activities (Taxonomy-aligned) | |||||||||||||||||||
| Electricity generation using solar photovoltaic technology | CCM 4.1 | 12.64 | 0.68 | Y | N/EL | N/EL | N/EL | N/EL | N/EL | Y | Y | Y | Y | Y | Y | Y | 0.06 | ||
| Urban and suburban transport, road passenger transport | CCM 6.3 | 132.68 | 7.19 | Y | N/EL | N/EL | N/EL | N/EL | N/EL | Y | Y | Y | Y | Y | Y | Y | 6.51 | ||
| Low carbon airport infrastructure | CCM 6.17 | 6.57 | 0.36 | Y | N/EL | N/EL | N/EL | N/EL | N/EL | Y | Y | Y | Y | Y | Y | Y | 0.11 | E | |
| Air transport ground handling operations | CCM 6.20 | 50.16 | 2.72 | Y | N/EL | N/EL | N/EL | N/EL | N/EL | Y | Y | Y | Y | Y | Y | Y | 0.00 | ||
| Installation, maintenance and repair of charging stations for electric vehicles in buildings (and parking spaces attached to buildings) | CCM 7.4 | 0.00 | 0.00 | Y | N/EL | N/EL | N/EL | N/EL | N/EL | Y | Y | Y | Y | Y | Y | Y | 0.02 | E | |
| Installation, maintenance and repair of instruments and devices for measuring, regulation and controlling energy performance of buildings | CCM 7.5 | 44.97 | 2.44 | Y | N/EL | N/EL | N/EL | N/EL | N/EL | Y | Y | Y | Y | Y | Y | Y | 1.83 | E | |
| Installation, maintenance and repair of renewable energy technologies | CCM 7.6 | 3.29 | 0.18 | Y | N/EL | N/EL | N/EL | N/EL | N/EL | Y | Y | Y | Y | Y | Y | Y | 0.00 | E | |
| Capex of environmentally sustainable activities (Taxonomy-aligned) (A.1) | 250.31 | 13.56 | 13.56% | 0% | 0% | 0% | 0% | 0% | 8.53 | ||||||||||
| Of which enabling | 54.83 | 2.97 | 2.97% | 0% | 0% | 0% | 0% | 0% | E | ||||||||||
| Of which transitional | 0.00 | 0.00 | 0.00% | T | |||||||||||||||
| A.2. Taxonomy-Eligible but not environmentally sustainable activities (not Taxonomy-aligned activities) |
|||||||||||||||||||
| EL; N/EL | EL; N/EL | EL; N/EL | EL; N/EL | EL; N/EL | EL; N/EL | ||||||||||||||
| Maintenance of roads and motorways | CE 3.4 | 41.65 | 2.26 | N/EL | N/EL | N/EL | N/EL | EL | N/EL | 1.00 | |||||||||
| Air transport ground handling operations | CCM 6.20 | 12.87 | 0.70 | EL | N/EL | N/EL | N/EL | N/EL | N/EL | 2.53 | |||||||||
| Construction of new buildings1) | CCM 7.1 | 0.00 | 0.00 | EL | N/EL | N/EL | N/EL | N/EL | N/EL | 61.84 | |||||||||
| Renovation of existing buildings1) | CCM 7.2 | 0.00 | 0.00 | EL | N/EL | N/EL | N/EL | N/EL | N/EL | 2.35 | |||||||||
| Installation, maintenance and repair of energy efficiency equipment | CCM 7.3 | 2.77 | 0.15 | EL | N/EL | N/EL | N/EL | N/EL | N/EL | 0.03 | |||||||||
| Installation, maintenance and repair of instruments and devices for measuring, regulation and controlling energy performance of buildings | CCM 7.5 | 0.00 | 0.00 | EL | N/EL | N/EL | N/EL | N/EL | N/EL | 0.08 | |||||||||
| Acquisition and ownership of buildings | CCM 7.7 | 1,196.83 | 64.84 | EL | N/EL | N/EL | N/EL | N/EL | N/EL | 0.00 | |||||||||
| Capex of Taxonomy-eligible but not environmentally sustainable activities (not Taxonomy-aligned activities) (A.2) | 1,254.13 | 67.94 | 67.94% | 0% | 0% | 0% | 0% | 0% | 67.83 | ||||||||||
| A. Capex of Taxonomy-eligible activities (A.1+A.2) |
1,504.43 | 81.51 | 81.51% | 0% | 0% | 0% | 0% | 0% | 76.36 | ||||||||||
| B. TAXONOMY-NON-ELIGIBLE ACTIVITIES | |||||||||||||||||||
| Capex of Taxonomy-non-eligible activities |
341.37 | 18.49 | 23.64 | ||||||||||||||||
| Total (A+B) | 1,845.80 | 100.00 | 100.00 | ||||||||||||||||
1) This economic activity was reclassified to economic activity 7.7 as of the 2024 reporting year. An explanation can be found in the body text under the section EU Taxonomy Performance Indicators”. | |||||||||||||||||||
Operating Expenditure (Opex) KPI
To determine the ratio of operating expenditure (Opex KPI), the taxonomy-eligible operating expenditure (numerator) according to the EU Taxonomy Regulation is set in relation to the operating expenditure (denominator).
The operating expenditure in accordance with the EU Taxonomy Regulation includes direct non-capitalized costs that relate to research and development, building renovation measures, short-term leasing, and maintenance and repair. Any other direct expenditure relating to the day-to-day servicing of assets of property, plant, and equipment by the undertaking or third parties is also included here.
Thus, the definition of operating expenditure in accordance with the EU Taxonomy Regulation clearly differs from the definition of operating expenses used in the rest of the combined management report (see chapter “Glossary”). For example, no expenses for utility services, such as energy expenditure, are included in the definition according to the EU Taxonomy Regulation. The ratio for operating expenditure (denominator) is calculated in accordance with the EU Taxonomy Regulation based on the income statement and mainly includes maintenance expenses and other operating expenditure for rents and leasing.
The taxonomy-eligible share in fiscal year 2024 results from maintenance expenses for the passenger transport system as well as maintenance expenses for rented buildings. In the case of economic activity “6.20 Air transport ground handling operations,” the expenses relate in particular to the maintenance of the baggage conveyor system. A formula was applied here, which guarantees an appropriate distribution of maintenance expenses based on the segment distribution. The main components of economic activity “3.4 Maintenance of roads and motorways” are the maintenance and renovation of runways.
In the same way as the revenue, the maintenance expenses for the passenger transport system are taxonomy-aligned operating expenditure. The maintenance expenses at the Greece site for the buildings that belong to the top 15% of national buildings with regard to energy efficiency are also aligned.
Taxonomy-aligned Opex includes, among other things, the maintenance costs of the passenger transport system of economic activity “6.3 Urban and suburban transport, road passenger transport” amounting to €9.94 million (previous year: €9.15 million) and the taxonomy-aligned share of Fraport Greece with economic activity “7.7 Acquisition and ownership of buildings” amounting to €6.40 million (previous year: €5.95 million). The Opex of economic activity “6.20 Ground handling operations” is taxonomy-aligned for the first time this reporting year and amounts to €3.08 million.
The amounts described in the following section are taxonomy-eligible but non-taxonomy-aligned operating expenditure. This includes taxonomy-eligible expenditure from economic activity “3.4 Maintenance of roads and motorways,” which amounted to €10.74 million (previous year: €11.03 million). Likewise, operating expenditure of economic activity “7.7 Acquisition and ownership of buildings” amounted to €53.98 million (previous year: €33.20 million). Here, too, the increase results from the reclassification of economic activity “7.2 Renovation of existing buildings” into economic activity 7.7.
| Proportion of operating expenses / Total operating expenses | ||
|---|---|---|
| Taxonomy-aligned per objective | Taxonomy-eligible per objective | |
| Climate Change Mitigation (CCM) | 10.14% | 42.09% |
| Climate Change Adaptation (CCA) | 0.00% | 0.00% |
| Water and marine resources (WTR) | 0.00% | 0.00% |
| Circular Economy (CE) | 0.00% | 5.35% |
| Pollution (PPC) | 0.00% | 0.00% |
| Biodiversity and ecosystems (BIO) | 0.00% | 0.00% |
| Template operating expenses (Opex) | |||||||||||||||||||
|---|---|---|---|---|---|---|---|---|---|---|---|---|---|---|---|---|---|---|---|
| Substantial contribution criteria | DNSH criteria (Does Not Significantly Harm) | ||||||||||||||||||
| Economic activities | Code(s) | Absolute Opex | Proportion of Opex 2024 | Climate change mitigation |
Climate change adaptation |
Water | Pollution | Circular Economy |
Biodiversity | Climate change mitigation |
Climate change adaptation |
Water | Pollution | Circular Economy |
Biodiversity | Minimum Safeguards |
Proportion of Taxonomy-aligned (A.1.) or -eligible (A.2.) Opex 2023 | Category enabling activity |
Category transitional activity |
| (1) | (2) | (3) | (4) | (5) | (6) | (7) | (8) | (9) | (10) | (11) | (12) | (13) | (14) | (15) | (16) | (17) | (18) | (19) | (20) |
| € mil. | % | Y; N; N/EL | Y; N; N/EL | Y; N; N/EL | Y; N; N/EL | Y; N; N/EL | Y; N; N/EL | Y/N | Y/N | Y/N | Y/N | Y/N | Y/N | Y/N | % | E | T | ||
| A. TAXONOMY-ELIGIBLE ACTIVITIES | |||||||||||||||||||
| A.1. Environmentally sustainable activities (Taxonomy-aligned) | |||||||||||||||||||
| Urban and suburban transport, road passenger transport | CCM 6.3 | 9.94 | 4.95 | Y | N/EL | N/EL | N/EL | N/EL | N/EL | Y | Y | Y | Y | Y | Y | Y | 5.13 | ||
| Low carbon airport infrastructure | CCM 6.17 | 0.09 | 0.05 | Y | N/EL | N/EL | N/EL | N/EL | N/EL | Y | Y | Y | Y | Y | Y | Y | 0.19 | E | |
| Air transport ground handling operations | CCM 6.20 | 3.08 | 1.53 | Y | N/EL | N/EL | N/EL | N/EL | N/EL | Y | Y | Y | Y | Y | Y | Y | 0.00 | ||
| Installation, maintenance and repair of instruments and devices for measuring, regulation and controlling energy performance of buildings | CCM 7.5 | 0.86 | 0.43 | Y | N/EL | N/EL | N/EL | N/EL | N/EL | Y | Y | Y | Y | Y | Y | Y | 0.00 | E | |
| Acquisition and ownership of buildings | CCM 7.7 | 6.40 | 3.18 | Y | N/EL | N/EL | N/EL | N/EL | N/EL | Y | Y | Y | Y | Y | Y | Y | 3.34 | ||
| Opex of environmentally sustainable activities (Taxonomy-aligned) (A.1) | 20.37 | 10.14 | 10.14% | 0% | 0% | 0% | 0% | 0% | 8.66 | ||||||||||
| Of which enabling | 0.95 | 0.47 | 0.47% | 0% | 0% | 0% | 0% | 0% | E | ||||||||||
| Of which transitional | 0.00 | 0.00 | 0.00% | T | |||||||||||||||
| A.2. Taxonomy-Eligible but not environmentally sustainable activities (not Taxonomy-aligned activities) |
|||||||||||||||||||
| EL; N/EL | EL; N/EL | EL; N/EL | EL; N/EL | EL; N/EL | EL; N/EL | ||||||||||||||
| Maintenance of roads and motorways | CE 3.4 | 10.74 | 5.35 | N/EL | N/EL | N/EL | N/EL | EL | N/EL | 6.19 | |||||||||
| Air transport ground handling operations | CCM 6.20 | 8.02 | 3.99 | EL | N/EL | N/EL | N/EL | N/EL | N/EL | 5.43 | |||||||||
| Renovation of existing buildings1) | CCM 7.2 | 0.00 | 0.00 | EL | N/EL | N/EL | N/EL | N/EL | N/EL | 4.61 | |||||||||
| Installation, maintenance and repair of energy efficiency equipment | CCM 7.3 | 2.20 | 1.09 | EL | N/EL | N/EL | N/EL | N/EL | N/EL | 0.02 | |||||||||
| Installation, maintenance and repair of instruments and devices for measuring, regulation and controlling energy performance of buildings | CCM 7.5 | 0.00 | 0.00 | EL | N/EL | N/EL | N/EL | N/EL | N/EL | 0.33 | |||||||||
| Acquisition and ownership of buildings | CCM 7.7 | 53.98 | 26.87 | EL | N/EL | N/EL | N/EL | N/EL | N/EL | 18.63 | |||||||||
| Opex of Taxonomy-eligible but not environmentally sustainable activities (not Taxonomy-aligned activities) (A.2) | 74.94 | 37.30 | 37.30% | 0% | 0% | 0% | 0% | 0% | 35.21 | ||||||||||
| A. Opex of Taxonomy-eligible activities (A.1+A.2) |
95.31 | 47.44 | 47.44% | 0% | 0% | 0% | 0% | 0% | 43.87 | ||||||||||
| B. TAXONOMY-NON-ELIGIBLE ACTIVITIES | |||||||||||||||||||
| Opex of Taxonomy-non-eligible activities |
105.61 | 52.56 | 56.13 | ||||||||||||||||
| Total (A+B) | 200.92 | 100.00 | 100.00 | ||||||||||||||||
1) This economic activity was reclassified to economic activity 7.7 as of the 2024 reporting year. An explanation can be found in the body text under the section EU Taxonomy Performance Indicators”. | |||||||||||||||||||
Disclosures on ESRS E1 Climate Change
General Disclosures
ESRS 2 General Disclosures
The operation of an airport and air traffic have various effects on the environment. Fraport is committed to take appropriate account of the resulting ecological requirements. One component of the environmental policy of Fraport places importance on the sustainable and careful use of natural resources.
Governance
Disclosure Requirement in Connection with ESRS 2 GOV-3 – Integration of Sustainability-related Performance in Incentive Schemes
Climate considerations are included in the remuneration of the members of the Executive Board. Two strategic corporate targets and one ESG target, each with a weighting of one third, were adopted for the 2024 fiscal year. The performance of the Executive Board members was not assessed in the year 2024 on the basis of the GHG emission reduction targets communicated in the context of disclosure requirement E1-4.
For further details on the integration of sustainability-related performance in incentive schemes, see also disclosures on ESRS 2 in connection with GOV-3.
Strategy
Disclosure Requirement E1-1 – Transition Plan for Climate Change Mitigation
According to the Intergovernmental Panel on Climate Change (IPCC), climate neutrality is to be achieved by 2050 in order to limit global warming to 1.5°C. In line with the Paris Climate Agreement and its 1.5-degree target, the members of the ACI (Airports Council International) Europe, including Fraport for Frankfurt Airport, have committed themselves to reducing GHG emissions to zero in their direct responsibility by 2050 (“net-zero carbon” according to IPCC).
In order to achieve this target, the Executive Board adopted the “decarbonization master plan” for Fraport AG in 2022 and specified it as a policy document for all sections and Group companies for inclusion in the other planning documents. After implementation at Fraport AG, the “decarbonization master plan” was successfully rolled out to all areas of the Fraport Group in the course of the 2023 fiscal year. The master plan is an important strategic measure of the Fraport.2030 Group strategy (see disclosure requirement E1-2). It is regularly reviewed and updated, with the latest update in 2024. The governance elements described in the master plan are implemented by the responsible sections.
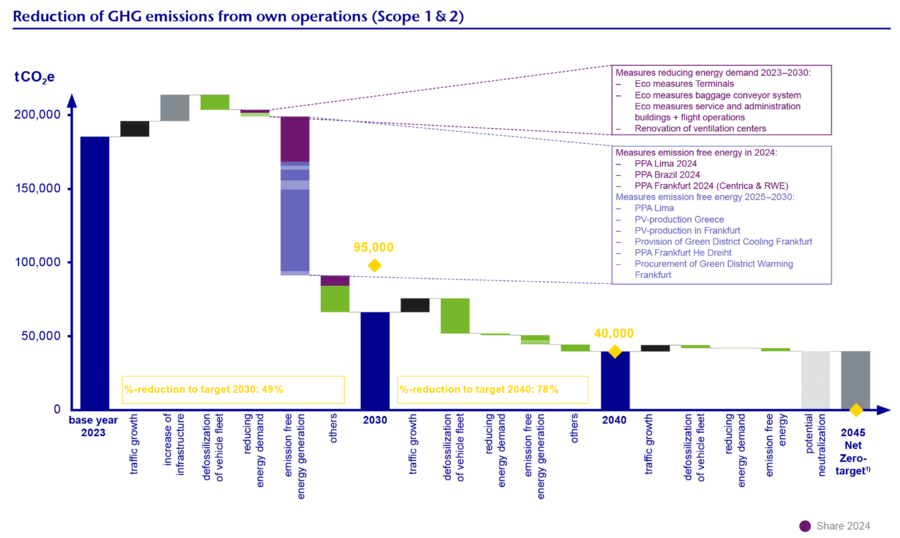
The master plan obligates the Fraport Group to achieve the target of net zero in Scope 1 and 2 in 2045 at its home site in Frankfurt and at the other fully consolidated sites worldwide. In addition, the master plan describes additional Scope 1 and 2 interim targets for 2030 and 2040. The Group is aiming to reduce GHG emissions (greenhouse gas emissions) to 95,000 t CO2e by 2030 and to 40,000 t CO2e by 2040. For Fraport AG, GHG emissions are to be reduced to 50,000 t CO2e by 2030 and to 25,000 t CO2e by 2040. The targets are to be achieved without compensation.
| Current GHG reduction targets of Fraport AG and the group | |||
|---|---|---|---|
| 2030 | 2040 | 2045 | |
| Fraport AG | 50,000 t CO2e | 25,000 t CO2e | 0 t CO2e (Net Zero) |
| Fraport Group | 95,000 t CO2e | 40,000 t CO2e | 0 t CO2e (Net Zero) |
For a detailed description of the targets, their achievement, and their compatibility with the Paris Agreement, see disclosure requirement E1-4. The emissions on which the master plan is based correspond to the accounting in accordance with disclosure requirement E1-6, which also includes the emissions from energy consumption of the group of consolidated companies in accordance with disclosure requirement E1-5.
To date, Fraport has not yet set targets for reducing Scope 3 emissions, which include emissions from the value chain. For the 2023 fiscal year, Scope 3 was collected completely for the consolidation group used in this report for the first time in accordance with the GHG Protocol (Greenhouse Gas Protocol), and the 15 individual categories were subjected to a significance assessment (see Section E1-6). In the case of airport operators, the Scope 3 emissions are determined by air traffic as well as by the incoming and outgoing delivery traffic on the landside.
Aviation is regarded as a sector that is difficult to decarbonize as technologies with sufficient energy density will not be available on the market in the foreseeable future, particularly for medium and long distances. Innovative drive technologies such as hydrogen for short and medium distances are currently still at an early stage of development. For drop-in fuels, also known as sustainable aviation fuel, there is currently a lack of sufficient production capacity to supply these quantities at competitive prices.
European aviation is the most regulated by international standards and is geared toward decarbonization. The European aviation sector is therefore under considerable pressure to find sustainable solutions. At Frankfurt Airport, Fraport and Deutsche Lufthansa are testing approaches to reducing jet fuel consumption and emissions from aviation. Fraport receives support from the Competence Center for Climate and Noise Protection in Aviation (CENA- Climate, Environment, and Noise Protection in Aviation) from the state of Hesse. Based on the experience gathered, Fraport will examine which targets Fraport can support in the Scope 3 area in order to push ahead with decarbonization.
The decarbonization master plan, which has so far been focused on Scope 1 and 2 emissions, is structured into areas of activity that result in three decarbonization levers. This classification allows the targets of energy consumption reduction and decarbonization to be assigned and process owners to be clearly named. The decarbonization levers are reduce energy requirements, change energy sources, and use emission-free energy.
The “reduce energy requirements” package of actions is a key component for achieving the GHG emission reduction targets. In the area of Scope 2 actions, packages of actions are combined to reduce the consumption of electricity, heat, and cooling. These actions are continuously implemented in the context of refurbishment, repair, and replacement of old equipment. The requirements of the Energy Efficiency Act and EU directives for the Frankfurt site are taken into account.
The “change energy sources” package of actions aims at transitioning from fossil to non-fossil energy sources. This concerns the GHG emissions from the combustion of fuels, which are included in Scope 1 of Fraport in the balance sheet, and is intended to contribute to the reduction of GHG emissions in this area. Actions include the defossilization of the fleet of ground services, which includes the conversion of the fleet to alternative drive types and the use of zero emission synthetic fuels for vehicles that cannot be converted to electric or hydrogen drives.
The “use emission-free energy” package of actions relates to the procurement of externally generated energy in the area of electricity, heating, and cooling, which is assigned to Scope 2. The use of emission-free energy is realized by energy suppliers switching their products to renewable energies or by commissioning new suppliers who already produce emission-free energy. By purchasing externally generated energy, Fraport contributes to the reduction of Scope 2 GHG emissions. In addition, Fraport is investing in its own photovoltaic systems to generate emission-free electricity and is thereby avoiding greenhouse gases from the procurement of non-renewable electricity.
At a higher level, packages of actions are defined that include actions that do not make a directly calculable or measurable contribution to decarbonization and cannot be assigned to specific scope categories. Nevertheless, they are important for achieving GHG emission reduction targets. These include, for example, actions to create supply infrastructure that enable a change of energy source as well as actions to control, determine, and allocate energy consumption. Actions are also described that support tracking of the implementation of the master plan.
For the expected contributions from the decarbonization levers and the most important climate change mitigation actions in each case, please refer to the explanations regarding disclosure requirement E1-4.
Appropriate capital expenditure is required to support the implementation of the decarbonization master plan financially. The following table shows the indicative annual cash outflow for the implementation of the decarbonization master plan at the Frankfurt site:
| Indicative annual outflow of funds for the implementation of the decarbonization master plan at the Frankfurt site | ||||||||||||
|---|---|---|---|---|---|---|---|---|---|---|---|---|
| Cash outflow in € million p.a. (rough indication with commercial caution) | ||||||||||||
| Decarbonization lever | Invest total (in Mio €) |
Actuals until 2023 | Actuals 2024 | 2025 | 2026 | 2027 | 2028 | 2029 | 2030 | 2031 | 2032 | 2033 |
| Reducing energy demand | 185.0 | 29.6 | 8.3 | 17.1 | 19.9 | 19.4 | 19.9 | 19.4 | 14.9 | 14.4 | 13.7 | 8.4 |
| Energy optimization of buildings, systems and facilities |
||||||||||||
| Baggage handling system | 5.0 | 1.7 | 0.0 | 0.1 | 0.4 | 0.4 | 0.4 | 0.4 | 0.4 | 0.4 | 0.4 | 0.4 |
| Buildings + flight operations | 20.0 | 0.4 | 0.6 | 1.5 | 2.0 | 2.5 | 3.0 | 3.0 | 2.0 | 2.0 | 2.0 | 1.0 |
| Terminal operations | 20.0 | 4.8 | 0.9 | 1.5 | 1.5 | 1.5 | 1.5 | 2.0 | 2.0 | 2.0 | 1.3 | 1.0 |
| Renovation of ventilation centers T1 | 140.0 | 22.7 | 6.8 | 14.0 | 16.0 | 15.0 | 15.0 | 14.0 | 10.5 | 10.0 | 10.0 | 6.0 |
| Change energy source | 12.5 | 1.0 | 1.0 | 1.0 | 1.0 | 1.0 | 1.0 | 1.5 | 1.5 | 0.9 | 0.9 | 0.6 |
| Defossilization of vehicle fleet | 12.5 | 1.0 | 1.0 | 1.0 | 1.0 | 1.0 | 1.0 | 1.5 | 1.5 | 0.9 | 0.9 | 0.6 |
| Emission free energy usage | 75.0 | 1.0 | 12.1 | 11.0 | 5.0 | 3.0 | 2.0 | 0.9 | 0.0 | 0.0 | 0.0 | 0.0 |
| Photovoltaic 18 West | 24.5 | 1.0 | 12.1 | 10.0 | 1.2 | 0.1 | 0.0 | 0.0 | 0.0 | 0.0 | 0.0 | 0.0 |
| Photovoltaic – further systems | 50.5 | 0.0 | 0.0 | 1.0 | 3.8 | 2.9 | 2.0 | 0.9 | 0.0 | 0.0 | 0.0 | 0.0 |
| Production of green district cooling1) | 0.0 | 0.0 | 0.0 | 0.0 | 0.0 | 0.0 | 0.0 | 0.0 | 0.0 | 0.0 | 0.0 | 0.0 |
| Overarching measures | 160.0 | 0.6 | 3.5 | 6.5 | 10.0 | 11.0 | 11.0 | 11.0 | 11.0 | 9.5 | 9.0 | 7.7 |
| Create infrastructure for alternative drives | 35.0 | 0.4 | 3.4 | 2.5 | 3.0 | 3.0 | 3.0 | 3.0 | 3.0 | 3.5 | 3.0 | 3.0 |
| Charging infrastructure customer car parks/parking spaces | 20.0 | 0.0 | 0.0 | 1.0 | 2.0 | 2.0 | 2.0 | 3.0 | 3.0 | 2.0 | 2.0 | 2.0 |
| Digital energy network | 25.0 | 0.2 | 0.1 | 1.0 | 2.0 | 3.0 | 3.0 | 3.0 | 3.0 | 3.0 | 3.0 | 1.7 |
| Energy storage | 80.0 | 0.0 | 0.0 | 2.0 | 3.0 | 3.0 | 3.0 | 2.0 | 2.0 | 1.0 | 1.0 | 1.0 |
| Sum Masterplan | 432.5 | 32.2 | 24.9 | 35.6 | 35.9 | 34.4 | 33.9 | 32.8 | 27.4 | 24.8 | 23.6 | 16.7 |
1) Various options are currently being examined for the “green district cooling” action as the specific implementation method has not yet been determined. | ||||||||||||
| Indicative annual outflow of funds for the implementation of the decarbonization master plan at the Frankfurt site | |||||||||||||
|---|---|---|---|---|---|---|---|---|---|---|---|---|---|
| Cash outflow in € million p.a. (rough indication with commercial caution) | |||||||||||||
| Decarbonization lever | Invest total (in Mio €) |
2034 | 2035 | 2036 | 2037 | 2038 | 2039 | 2040 | 2041 | 2042 | 2043 | 2044 | 2045 |
| Reducing energy demand | 185.0 | 0.0 | 0.0 | 0.0 | 0.0 | 0.0 | 0.0 | 0.0 | 0.0 | 0.0 | 0.0 | 0.0 | 0.0 |
| Energy optimization of buildings, systems and facilities |
|||||||||||||
| Baggage handling system | 5.0 | 0.0 | 0.0 | 0.0 | 0.0 | 0.0 | 0.0 | 0.0 | 0.0 | 0.0 | 0.0 | 0.0 | 0.0 |
| Buildings + flight operations | 20.0 | 0.0 | 0.0 | 0.0 | 0.0 | 0.0 | 0.0 | 0.0 | 0.0 | 0.0 | 0.0 | 0.0 | 0.0 |
| Terminal operations | 20.0 | 0.0 | 0.0 | 0.0 | 0.0 | 0.0 | 0.0 | 0.0 | 0.0 | 0.0 | 0.0 | 0.0 | 0.0 |
| Renovation of ventilation centers T1 |
140.0 | 0.0 | 0.0 | 0.0 | 0.0 | 0.0 | 0.0 | 0.0 | 0.0 | 0.0 | 0.0 | 0.0 | 0.0 |
| Change energy source | 12.5 | 0.6 | 0.5 | 0.0 | 0.0 | 0.0 | 0.0 | 0.0 | 0.0 | 0.0 | 0.0 | 0.0 | 0.0 |
| Defossilization of vehicle fleet | 12.5 | 0.6 | 0.5 | 0.0 | 0.0 | 0.0 | 0.0 | 0.0 | 0.0 | 0.0 | 0.0 | 0.0 | 0.0 |
| Emission free energy usage | 75.0 | 0.0 | 0.0 | 2.0 | 3.0 | 4.0 | 5.0 | 5.0 | 5.0 | 5.0 | 5.0 | 3.0 | 3.0 |
| Photovoltaic 18 West | 24.5 | 0.0 | 0.0 | 0.0 | 0.0 | 0.0 | 0.0 | 0.0 | 0.0 | 0.0 | 0.0 | 0.0 | 0.0 |
| Photovoltaic – further systems | 50.5 | 0.0 | 0.0 | 2.0 | 3.0 | 4.0 | 5.0 | 5.0 | 5.0 | 5.0 | 5.0 | 3.0 | 3.0 |
| Production of green district cooling1) | 0.0 | 0.0 | 0.0 | 0.0 | 0.0 | 0.0 | 0.0 | 0.0 | 0.0 | 0.0 | 0.0 | 0.0 | 0.0 |
| Overarching measures | 160.0 | 5.2 | 4.0 | 2.5 | 4.5 | 5.0 | 7.0 | 7.0 | 8.0 | 8.0 | 7.0 | 6.0 | 5.0 |
| Create infrastructure for alternative drives | 35.0 | 2.2 | 2.0 | 0.0 | 0.0 | 0.0 | 0.0 | 0.0 | 0.0 | 0.0 | 0.0 | 0.0 | 0.0 |
| Charging infrastructure customer car parks/parking spaces | 20.0 | 1.0 | 0.0 | 0.0 | 0.0 | 0.0 | 0.0 | 0.0 | 0.0 | 0.0 | 0.0 | 0.0 | 0.0 |
| Digital energy network | 25.0 | 1.0 | 1.0 | 0.0 | 0.0 | 0.0 | 0.0 | 0.0 | 0.0 | 0.0 | 0.0 | 0.0 | 0.0 |
| Energy storage | 80.0 | 1.0 | 1.0 | 2.5 | 4.5 | 5.0 | 7.0 | 7.0 | 8.0 | 8.0 | 7.0 | 6.0 | 5.0 |
| Sum Masterplan | 432.5 | 5.8 | 4.5 | 4.5 | 7.5 | 9.0 | 12.0 | 12.0 | 13.0 | 13.0 | 12.0 | 9.0 | 8.0 |
1) Various options are currently being examined for the “green district cooling” action as the specific implementation method has not yet been determined. | |||||||||||||
The actions listed in the table to achieve the GHG emission reduction targets have been allocated indicative costs and shown in the master plan. Due to the long duration of the actions, some estimates are rough and subject to uncertainties, and may change over time. The total costs were determined on the basis of the principles of commercial prudence and usually include increased costs for uncertainties based on the limited planning depth. The distribution of the total capital expenditure over the individual years was deliberately conservative in view of the currently very difficult conditions.
For the 2024 fiscal year, approximately €21.4 million in taxonomy-aligned Capex is attributable to capital expenditure in connection with the decarbonization master plan at the Frankfurt site in accordance with Delegated Regulation (EU) 2021/2178. This Capex includes projects of economic activities “4.1 Electricity generation using solar photovoltaic technology” “6.17 Low carbon airport infrastructure,” and “7.5 Installation, maintenance, and repair of instruments and devices for measuring, regulating, and controlling energy performance of buildings.” The underlying projects are the expansion of the photovoltaic system on Runway 18 West, the construction of charging stations for electric vehicles on the apron, and the renovation of technical centers in Terminal 1. The transfer of the capital expenditure of the decarbonization master plan to the EU Taxonomy is based on an allocation of projects based on their project number. The master plan includes decarbonization actions while the EU Taxonomy is aimed at general, sustainable economic activities.
As part of the decarbonization master plan, Fraport is forecasting the remaining emissions under Scope 1 and 2 for the remaining years until the net-zero target is reached in 2045, taking into account planned actions and expected growth. The emission curve corresponds to the required average annual reduction as proposed in scientific-based targets such as the SBTI Net Zero Standard v1.2 for a 1.5° scenario. The forecast does not give rise to any significant locked-in emissions that could endanger this target path
Fraport plans to develop a forecasting model for the most significant Scope 3.11 emissions - greenhouse gas emissions from air traffic. This model is to be based on industry-relevant technology scenarios, such as the International Civil Aviation Organization (ICAO) or ACI scenarios. However, the expected emissions included in these scenarios do not result from Fraport's services, but rather from the business operations of its partners in the value chain. The multi-sector and inter-company decarbonization plans, some of which are supported by feasibility studies, also aim for net emission-neutral flight operations by 2050 but also take into account compensation procedures.
In addition to the packages of measures and targets, the decarbonization master plan also includes investment costs. Some of these investments correspond to economic activities in accordance with the Taxonomy Regulation (EU) 2020/852. Further information on this can be found under the disclosure requirement E1-2 and in the section “Disclosures on the EU Taxonomy Regulation”. There are no separate targets or capex plans for achieving taxonomy-compliant economic activities in accordance with the Taxonomy Regulation.
As an important strategic measure of the Fraport.2030 Group strategy, the capital expenditure in the decarbonization master plan is embedded in the ongoing renewal cycles of the existing asset structures and is therefore taken into account in the expanded business plan. This is intended to avoid unscheduled expenses. Funding is requested on a case-by-case basis and included in the financing. In addition, dedicated sustainable financing actions are continuously reviewed and implemented as part of the financing strategy.
In the 2024 reporting year, there were no significant Capex amounts invested in connection with economic activities in the coal, oil, and gas sectors.
According to the criteria stated in Article 12(1)(d) to (g) and Article 12(2) of Commission Delegated Regulation (EU) 2020/1818, Fraport is not exempted from the EU Paris-aligned Benchmarks.
Impacts, Risks and Opportunities Management
Fraport has examined climate-related risks, impacts, and opportunities as part of the DMA. A final assessment of the climate-related physical risks and climate-related transition risks for the entire Fraport Group is planned for subsequent years. A description of the current process and status can be found under the disclosure requirement related to IRO-1.
Qualitative discussions conducted with the experts in the relevant departments during the DMA did not identify any climate change-related risks that would jeopardize the resilience of the Fraport strategy or business model in the short and medium term. Fraport has not yet fully assessed the long-term climate risks (see disclosure requirement E1 in conjunction with ESRS 2 IRO-1) in terms of the long-term resilience of the business model and its strategy.
Disclosure Requirement Related to ESRS 2 IRO-1 – Description of the Processes to Identify and Assess Material climate-related Impacts, Risks, and Opportunities
With regard to the impacts of Fraport on climate change, reference is made to disclosure requirements E1-1, E1-and E1-6 as well as to ESRS 2 SBM-3.
Fraport has conducted a climate-related scenario analysis to determine and evaluate physical climate risks. Climate data for the Frankfurt site and for the international operator concessions was analyzed as part of this process. The value chain was not considered further, as the impacts were not considered permanent or material for Fraport. For the time horizon analysis, only the longest term was taken into account in this first analysis, as this covers the most severe climate risks and thus provides a solid basis. Climate risks that are significant in the long term are usually also relevant in the short and medium term. The year 2100 was chosen as the time horizon for Fraport AG with the Frankfurt site and Fraport Slovenia as an operator concession with no time limit. The year 2040 was selected for Peru and the year 2050 for the remaining international operator concessions, as these periods are based on the end of the respective concessions. The long-term time horizons were chosen as they best correspond to the long-term strategic planning and capital allocation for the operator concessions.
The climate risk analysis is based on the evaluation of the “Location Risk Intelligence” of Münchener Rückversicherungs-Gesellschaft AG (MunichRe) from October 2024. The climate data is based on location-specific geographical coordinates and aligned with the table for the classification of climate-related hazards pursuant to Commission Delegated Regulation (EU) 2021/2139. The data includes all climate risks except soil degradation and solifluction. For further information, see the section “Information on the EU Taxonomy Regulation.”
IPCC scenario SSP5-8.5, which assumes a high level of emissions, is used as the basis for the assessment. This scenario forecasts strong economic growth and intensive use of fossil fuels, leading to a rise in the global average temperature of 4.4°C by 2100. This scenario is based on the scientific basis of the IPCC Sixth Assessment Report (IPCC AR6). The climate scenario used is assumed to be the worst-case scenario in order to be optimally prepared for future developments. The data was validated by expert interviews.
The analysis identified indications of existing and potential climate risks. The preliminary assessment is based on a risk classification on a scale of 1 to 5, which has been drawn up by MunichRe on the basis of internal climate models and geographical coordinates. The internal models used take into account the probability of occurrence, impact, and duration of the risks.
Fraport is committed to further developing the process for the detailed analysis and assessment of climate risks in order to meet the increased requirements of the ESRS. A more comprehensive analysis for the entire Fraport Group is planned for subsequent years. This analysis will include an assessment of the climate risks, including the impact level and the susceptibility of assets and business activities.
Fraport analyzed the climate-related transition risks and opportunities at the Frankfurt site and at the international operator concessions. The value chain was indirectly included in the analysis, as transition risks are by definition also influenced by the dependencies and changes related to other actors in the value chain, such as the costs of the airlines and other relevant factors.
The current scientific status of the “Net Zero Emissions” 1.5°C scenario of the International Energy Agency (IEA) is used to determine climate-related transition risks and opportunities. This scenario describes a path to reduce global net GHG emissions to zero by 2050 in order to limit global warming to 1.5°C compared to pre-industrial levels and avoid the severe consequences of climate change. Fraport believes that this scenario, with its comprehensive consideration of scientific findings, technological developments, and policy actions, presents a wide range of plausible risks and uncertainties and thus provides a sound basis for assessing climate-related transition risks and opportunities. Fraport is aware that the scenario has its limitations with regard to assumptions, regional differences, technology dependence, behavioral changes, political implementation, economic impact, and long-term forecasting reliability.
Based on this assumption, Fraport discussed and evaluated the transition risks and opportunities in workshops with experts from the fields of market research, sustainability, risk management, investment management, and reporting. The workshops considered politics, technology, markets, and reputation in their examination of transition risks as well as resources, energy, products and services, markets, and resilience in their examination of transition opportunities. The main driving forces that Fraport considered are policy actions to reduce emissions, the transition to a sustainable energy mix, technological innovations in aviation, and changes in market requirements and consumer habits, as these factors influence the future business development of Fraport.
The transition events were analyzed in the short, medium, and long term, looking at the periods 2026, 2035, and 2050. The probability of occurrence and impact level were estimated for the short term, while the trend of the expected risk development was indicated for the medium and long-term assessment. In subsequent years, Fraport has planned to conduct further analyses and assessments of the extent to which the undertaking’s assets and business activities are exposed to the identified transition risks or opportunities. A comprehensive resilience analysis has not been carried out and therefore no statements can be made about the resilience of the business model.
Disclosure Requirement E1-2 – Policies Related to Climate Change Mitigation and Adaptation
Fraport has anchored the aspects of climate change mitigation, climate change adaptation, energy efficiency, and the use of renewable energies in the Group strategy, which focuses on the strategic priorities of growth and sustainability and efficiency and innovation. The actions derived on this basis are implemented in important strategic measures (see also the “Strategy” chapter), among other areas.
The strategy aims to establish Fraport as a leading company in the operation of climate-friendly airports. A core aspect of this priority is the “decarbonization master plan,” which was first adopted in the 2022 reporting year and has since been updated. The master plan has been extended to include the entire group of consolidated companies under operational control as well as all greenhouse gases in accordance with the GHG Protocol.
The reduction of GHG emissions that are the direct responsibility of Fraport takes precedence over emissions in the value chain. The decarbonization master plan therefore focuses on GHG emissions in Scopes 1 and 2. Fraport assessed Scope 3 for the aforementioned group of consolidated companies across all 15 categories of the GHG Protocol for the first time in the reporting year and reported on the significant categories. On this basis, Fraport will examine whether and how its climate change mitigation strategy can be developed further in the future in order to address the material impacts of its business model on the greenhouse gas inventory (see IRO-1).
The energy consumption of Fraport infrastructures and processes is the main cause of its GHG emissions. As a material impact (see IRO-1), this is therefore a focus area for the decarbonization master plan – supporting the pursuit of efficiency in line with the strategic priority of Fraport. The strategic decarbonization levers include reducing energy consumption, switching to lower-emission energy sources, and producing emission-free energy. These three levers are supplemented by higher-level actions aimed at distributing and managing energy demand more efficiently.
The Corporate Development unit is responsible for the Group-wide management of the decarbonization master plan, while the companies implement the plan at the sites. Progress is monitored by the Decarbonization Board, which is overseen by the Executive Board. The regular Decarbonization Board members comprise the responsible unit managers or their designated representatives. The Corporate Development and Sustainability unit coordinates the Board, while the Corporate Infrastructure Management, Cost and Result Controlling, and Investment and Project Controlling unit managers are responsible for the operational planning and implementation of the actions. If necessary, additional participants, such as from relevant site companies, may be included. If the decarbonization of relevant foreign companies is being addressed, the Acquisitions and Investments unit will participate in the Board. The actions decided on in the Decarbonization Board are then integrated into the medium-term planning of the Group companies.
As stated in disclosure requirement E1-1, the analysis phase of Fraport in relation to the risks and opportunities of ongoing climate change has not yet concluded. The need for an adaptation strategy, for example for extreme weather events, will be examined beyond the treatment of this issue in the context of the risk management system as part of the subsequent resilience analysis.
Disclosure Requirement E1-3 – Actions and Resources in Relation to Climate Change Strategies
The key actions related to energy consumption and emissions in Scope 1 and 2 are assigned to the Frankfurt site since this site is the main contributor to emissions within the Group. In the reporting year, the focus was on the decarbonization lever “use emission-free energy.” The installation of photovoltaic systems with a capacity of 17 MWp spanning a length of 2,800 m parallel to the Runway West in Frankfurt in the final expansion stage is particularly noteworthy in this regard. Inauguration is planned to take place in stages in the first and third quarters of 2025. Fraport also procures green wind energy for the Frankfurt site. Several power purchase agreements (PPA) with various suppliers supplied Frankfurt Airport with around 160 gigawatt hours of wind power in 2024. This energy was generated from various onshore and offshore wind turbines.
The individual actions currently planned as part of the decarbonization lever “reduction of energy demand” are not material to this report in terms of their respective scope. Firstly, a considerable part of this lever has been realized in the past, and secondly, plans for future actions are still at a very early stage.
Key actions that Fraport has planned for the coming years as part of the “change energy sources” decarbonization lever include the ongoing electrification of the vehicle fleets at the Frankfurt site. In addition, the undertaking is continuing with the expansion of a fast-charging infrastructure on the airport apron and the installation of charging points throughout the entire airport site. The PPA concluded with EnBW at the end of 2021 for the supply of electricity from the “He Dreiht” wind farm is expected to make a substantial contribution to the decarbonization of Frankfurt Airport from mid-2026.
Other actions planned at the Frankfurt site as part of the decarbonization lever “use emission-free energy” include the conversion of district cooling to climate-neutral energy and the expansion of the procurement of green district heating. A key individual action in terms of the foreign Group companies will be the conclusion of a PPA for the airport in Lima. In addition, a package of energy optimization actions at Fraport Greece airports is intended to help reduce the GHG emissions of Fraport Greece by 2030.
In order to achieve the net-zero target in Scopes 1 and 2 by 2045, the foreign airport Group companies of Fraport are also implementing a number of actions to decarbonize their business activities. These actions are at different stages of development, from initial project ideas through to detailed implementation plans anchored in medium-term budget plans. Actions to reduce GHG emissions have already been successfully implemented at some Group companies and are continuously being developed further. As the respective individual contributions are minor compared to the Group headquarters, detailed information is not provided here.
Due to the coherent frame of reference, the reductions achieved and expected to be achieved by current actions and actions planned for the future are also illustrated in the graphic under the disclosure requirement E1-4. The contributions achieved and expected to be achieved in the future as a result of the key actions are assigned to the higher-level decarbonization targets in the table under disclosure requirement E1-4.
In the 2024 fiscal year, significant capital expenditure was incurred at the Frankfurt site as part of the decarbonization master plan with €12.1 million for the expansion of the ground-mounted photovoltaic system, €6.8 million for the renovation of technical centers, and €3.4 million for the installation of charging stations for electric vehicles. The latter is part of a set of actions that indirectly support the aforementioned decarbonization levers. The significant capital expenditure amounts expected to be incurred in the future for the key actions are shown in the table on the financing of the transition plan under the disclosure requirement E1-1.
These actions are also classified as Taxonomy-aligned Capex in the reporting year in accordance with Commission Delegated Regulation (EU) 2021/2178. The photovoltaic system is assigned to the economic activity “4.1 Electricity generation using solar photovoltaic technology” and comprises Taxonomy-aligned Capex amounting to €12.1 million. The Taxonomy-aligned Capex amounts to €3.4 million for the charging stations that come under “6.17 Low carbon airport infrastructure.” The renovation of the technical centers comes under letter (b) of the economic activity “7.5 Installation, maintenance, and repair of instruments and devices for measuring, regulating, and controlling energy performance of buildings” and comprises Taxonomy-aligned Capex in the amount of €5.9 million. The capital expenditure amounts for the decarbonization master plan are not identical to the Capex amounts for the EU Taxonomy, as a materiality threshold is applied to projects for these amounts and the scope and delimitation of the actions differ.
For the PPAs at the Frankfurt site, additional expenditure of €2.7 million is expected for 2025 as a result of the price difference between the spot market forecast and PPAs. The price difference was positive for the reporting year. An advantageous price difference is also expected from the 2026 fiscal year until the end of the term of the current PPAs.
For the period from 2025 to 2030, Fraport Greece plans to invest around € 6 million in the energy optimization of the terminals at the operated airports and the installation of photovoltaic systems at all 14 airports with a total volume of around € 19 million. Due to the early planning stage, the final costs may deviate from this. No significant capex or opex amounts were recorded at the remaining Group sites in the 2024 financial year.
Metrics and Targets
Disclosure Requirement E1-4 – Targets Related to Climate Change Mitigation and Adaptation
The implementation and effectiveness of the actions are regularly reviewed and reported to the Executive Board and the Decarbonization Board. The targets are continuously monitored. If necessary, additional actions are introduced (see disclosure requirement E1-2). The results are included in the Group’s non-financial report.
1) The goal is complete avoidance as far as technically and economically feasible. For unavoidable residual gross emissions, see E1-7, in alignment with the 1.5° target. Decarbonization levers represent the currently planned potential measures. For key measures (bundles) of over 1,000 tCO2e/a, see the boxes. Unless otherwise specified, all key measures (bundles) apply to the Frankfurt site.
As part of the current report, Fraport has expanded the scope of application as follows and redefined the reference year as 2023. The targets for the Scope 1 and 2 categories relate to the activities accounted for in accordance with the disclosures under disclosure requirements E1-5 and E1-6, which are under the operational control of the Fraport Group and are evaluated according to the market-based assessment for greenhouse gases in accordance with the GHG Protocol. The target adopted by the Executive Board for 2045 is a net-zero target. Fraport has not yet formulated a corresponding gross emission reduction target for greenhouse gases overall.
Fraport determined the Scope 3 emissions for the first time as part of its reporting for fiscal year 2024. For this reason, no policies, specific targets, or comprehensive actions within the meaning of the ESRS have been implemented at the time of publication of this report. In order to develop such policies, targets, and actions, Fraport engages in dialog in various formats and takes the following approaches to reduce Scope 3 emissions within the industry and at Frankfurt Airport.
At the Frankfurt site, Fraport is currently trialing and gaining initial experience in single-engine taxiing and reduced-engine taxiing out together with Deutsche Lufthansa. In addition, the parking positions on the apron are being equipped with ground power systems and, as part of a pilot project, with pre-conditioned air systems for the aircraft in order to reduce fuel consumption on the ground.
Fraport currently expects residual emissions in Scope 1 and 2 of around 40,000 metric tonnes of CO2e for the target year 2045. This is slightly above the emissions cap of 37,600 metric tonnes of CO2e for the year 2045, which is derived from the SBTi Net Zero Standard to meet the 1.5°C target for Fraport. However, the current planning of measures does not yet cover all reduction potential. The interim target for 2030 provides for an annual linear reduction of around 6.9% compared to the base year and therefore exceeds the required SBTi target of 6.0%. Accordingly, the interim target for 2040 envisages an annual linear reduction of around 3.0%, which also exceeds the SBTi target of 2.4% for the period from 2030 to 2050. If emissions are extrapolated beyond the target year 2045, Fraport expects a reduction of 90% by 2050 compared to the base year. Compliance with a 1.5°C reduction target in Scope 1 and 2 is therefore still considered achievable. The residual emissions expected under the current net zero target for 2045 therefore enable compliance with a Paris-compliant 1.5°C trajectory for Scope 1 and 2.
The emissions in 2023 are considered to be representative, as traffic volumes have largely normalized after the pandemic. Emissions at the Frankfurt site will continue to level out at pre-crisis levels over the coming years, with no irregularities expected in the GHG balance. After performing a comparative analysis of the annual temperature curves at its sites against the long-term average energy consumption, which did not show any significant deviations, Fraport decided not to normalize the base year 2023.
The guidelines for setting the GHG emission reduction targets of Fraport are based on the European Green Deal, the EU’s Fit for 55 legislation, and the national decarbonization plans of the Federal Republic of Germany and, if available, the countries of the Group airports. Fraport has formulated its target ambitions on the basis of these framework conditions and taking into account the internal models of the airport sites. The models reflect the traffic growth forecasts and infrastructure changes. Expected transitory effects, for example from the aforementioned regulations, were factored into the traffic forecasts by Fraport.
The development of air traffic has a direct impact on GHG emissions and thus influences the achievement of GHG emission reduction targets. Passenger growth increases Scope 1 emissions in particular, as these emissions are mainly due to the fuel consumption of ground services vehicles at the Frankfurt site. An increase in the number of passengers means more passengers and luggage being transported, which results in increased fuel consumption and demand. Fraport expects traffic to develop positively in the long term. The expected change in traffic growth is included in the forecast calculation and is taken into account in action planning.
Special effects can also occur that have an impact on energy consumption and thus GHG emissions. These special effects can have both an increasing and decreasing effect, and may arise from geopolitical, economic, or regulatory factors. Pandemics are an example of this. The COVID-19 pandemic led to a drop in aircraft movements and thus a reduction in baggage checking by ground services. At the same time, energy consumption in the administration buildings declined in part due to an increase in home working.
Disclosure Requirement E1-5 – Energy Consumption and Mix
| Line | Energy consumption and energy mix | Unit | 2024 | 2023 |
|---|---|---|---|---|
| Fuel consumption from | ||||
| 1 | Coal and coal products | MWh | - | - |
| 2 | Crude oil and petroleum products | MWh | 110,172 | 110,719 |
| 3 | natural gas | MWh | 8,200 | 5,696 |
| 4 | other fossil sources | MWh | 4,459 | 2,747 |
| 5 | Consumption from purchased or received electricity, heat, steam and cooling (district heating, district cooling) | MWh | 311,896 | 339,171 |
| 6 | Total consumption of fossil energy | MWh | 434,726 | 458,333 |
| Share of fossil sources in total energy consumption | % | 50 | 53 | |
| 7 | Consumption from nuclear power sources | MWh | 8,333 | 9,177 |
| Share of consumption from nuclear sources in total energy consumption | % | 1 | 1 | |
| 8 | Fuel consumption from renewable sources, including biomass (also industrial and municipal waste of biological origin, biogas, hydrogen from renewable sources, etc.) | MWh | 10,279 | 8,427 |
| 9 | Consumption from purchased or received electricity, heat, steam and cooling and from renewable sources | MWh | 406,206 | 387,957 |
| 10 | Consumption from generated renewable energy other than fuels (district heating, district cooling) | MWh | 1,323 | 1,461 |
| 11 | Total consumption of renewable energy | MWh | 417,809 | 397,844 |
| Share of renewable sources in total energy consumption | % | 49 | 46 | |
| Total energy consumption (sums of lines 6, 7 and 11) |
MWh | 860,868 | 865,354 |
| Energy intensity per net revenue | |||
|---|---|---|---|
| in (MWh/EUR) | 2024 | 2023 | Change in % |
| Total energy consumption from activities in climate-intensive sectors per net revenue from activities in climate-intensive sectors | 0.00019 | 0.00022 | -10 |
| Total energy consumption from activities in climate-intensive sectors per net revenue from activities in climate-intensive sectors excluding IFRIC 12 | 0.00022 | 0.00025 | -11 |
Fraport operates almost exclusively in high climate impact sectors. For this reason, the total net revenue and the total energy consumption were used to determine the energy intensity. The total net revenue is represented by the revenue calculated in accordance with IFRS 15. In addition, revenue adjusted for contract revenue from construction and expansion services in accordance with IFRIC 12 is used to calculate energy intensity (see Group Notes, note 5). The Fraport Group operates in the following high climate impact sectors:
- Section D – Electricity, gas, steam, and air conditioning supply
- Section E – Water supply, sewerage, waste management and remediation activities
- Section F – Construction
- Section G – Wholesale and retail trade; repair of motor vehicles and motorcycles
- Section H – Transportation and storage
- Section L – Real estate activities
Disclosure Requirement E1-6 – Gross Scopes 1, 2, 3 and Total GHG emissions
| Gross Scopes 1, 2, 3 and Total GHG emissions | ||||||||
|---|---|---|---|---|---|---|---|---|
| Retrospective | Milestones and target years | |||||||
| Base year 2023 |
Comparative 2023 |
2024 | Change in % | 2030 | 2040 | 2045 | Annual % target / Base year | |
| Scope 1 GHG emissions | ||||||||
| Gross Scope 1 GHG emissions (t CO2e) | 36,235 | 36,235 | 36,555 | +1 | see combined target Scope 1 and 2 | |||
| Percentage of Scope 1 GHG emissions from regulated emission trading schemes (%) | – | – | – | – | ./. | |||
| Scope 2 GHG emissions | ||||||||
| Gross location-based Scope 2 GHG emissions (t CO2e) | 197,787 | 197,787 | 194,605 | –2 | ./. | |||
| Gross market-based Scope 2 GHG emissions (t CO2e) | 148,499 | 148,499 | 122,942 | –17 | see combined target Scope 1 and 2 | |||
| Scope 1&2 GHG emissions | ||||||||
| Gross Scope 1 GHG emissions + gross market-based Scope 2 GHG emissions (t CO2e) | 184,734 | 184,734 | 159,496 | –14 | 95,000 | 40,000 | 0 (netto) | 4,6 % p.a. (2040) |
| Significant Scope 3 GHG emissions | ||||||||
| Total Gross indirect (Scope 3) GHG emissions (t CO2e) | 22,079,574 | 22,079,574 | 22,204,800 | +1 | Currently not yet defined | |||
| 1 Purchased goods and services | 101,581 | 101,581 | 161,600 | +59 | ||||
| 2 Capital goods | 330,248 | 330,248 | 226,178 | –32 | ||||
| 3 Fuel and energy-related Activities (not included in Scope 1 and 2) | 40,907 | 40,907 | 36,057 | –12 | ||||
| 7 Employee commuting | 50,048 | 50,048 | 43,880 | –12 | ||||
| 11 Use of sold products | 18,760,442 | 18,760,442 | 18,957,072 | +1 | ||||
| Aircraft Emissions | 17,820,731 | 17,820,731 | 17,812,231 | 0 | ||||
| Landside Access | 883,395 | 883,395 | 1,089,772 | +23 | ||||
| Tenant Services | 56,316 | 56,316 | 55,069 | –2 | ||||
| 15 Investments | 2,796,349 | 2,796,349 | 2,780,013 | –1 | ||||
| Total GHG emissions | ||||||||
| Total GHG emissions (location-based) (t CO2e) | 22,313,596 | 22,313,596 | 22,435,960 | +1 | ||||
| Total GHG emissions (market-based) (t CO2e) | 22,264,308 | 22,264,308 | 22,364,296 | 0 | ||||
| Biogenic THG-Emissions (Out of Scope) | ||||||||
| Biogenic CO2 emissions from the combustion or biological decomposition of biomass that are not included in Scope 1 greenhouse gas emissions. | 1,358 | 1,358 | 2,773 | +104 | ||||
| Biogenic CO2-emissions from the combustion or biological decomposition of biomass that are not included in Scope 2 greenhouse gas emissions. | 45,348 | 45,348 | 35,600 | –21 | ||||
The emissions balance is determined in accordance with the principles of the GHG Protocol. Significant assumptions and uncertainties as well as the emission factors used for Scopes 1, 2, and 3 are described within the scope of ESRS 2 BP-2.
The scope of consolidation corresponds to the group consolidated for accounting purposes (the parent company and the subsidiaries) and to operational control. No operational control could be established for not fully consolidated Group companies. Therefore, their GHG emissions were recognized within Scope 3. In the event of significant changes to this definition, these will be indicated and the effects on the annual comparability of the GHG emissions provided will be explained.
Of the 15 categories in the GHG Protocol, three are not relevant to Fraport on account of its business model and were not evaluated:
- 3.9 Downstream transportation and distribution
- 3.10 Processing of sold products
- 3.14 Franchises
For the remaining twelve categories, Fraport prepared an initial account for the 2023 fiscal year and then evaluated their significance, taking into account the magnitude, influenceability, possible risks, stakeholder relevance, outsourcing of activities, and sector standards (in accordance with ESRS E1-6 AR 46 d), and considered the key questions derived accordingly:
Scope of emissions:
- Is the contribution to the total Scope 3 emissions significant?
- Is the category needed for the required coverage?
Area of influence and emission reduction potential:
- How much influence does Fraport have on the reduction of emissions?
- What is the emission reduction potential?
In conducting this assessment, Fraport identified the following Scope 3 categories as significant; these categories account for over 98% of the Scope 3 emissions from the 2023 greenhouse gas inventory:
- 3.1 Purchased goods and services
- 3.2 Capital goods
- 3.3 Fuel- and energy-related activities (not included in Scope 1 or Scope 2)
- 3.7 Employee commuting
- 3.11 Use of sold products
- 3.11a Aircraft emissions
- 3.11b Landside access
- 3.11c Tenant services
- 3.15 Investments
Because of its significance, Category 3.11 is divided into the sub-categories “Aircraft emissions,” “Tenant services,” and “Landside access.”
The proportion of Scope 3 emissions from primary emissions data from the value chain amounted to 87.0% in the reporting year.
| GHG intensity per net revenue | |||
|---|---|---|---|
| in (t CO2e/currency unit) | 2024 | 2023 | Change in % |
| Total GHG emissions (location-based) per net revenue | 0.0050680 | 0.0055780 | –9 |
| Total GHG emissions (market-related) per net revenue | 0.0050520 | 0.0055650 | –9 |
| Total GHG emissions (location-based) per net revenue without IFRIC 12 | 0.0057640 | 0.0064030 | –10 |
| Total GHG emissions (market-related) per net revenue without IFRIC 12 | 0.0057460 | 0.0063890 | –10 |
The revenue determined in accordance with IFRS 15 is used to calculate the GHG intensity (see Group Notes, note 5). As an additional metric, the GHG intensity is shown in relation to the revenue adjusted in accordance with IFRIC 12 (see Group Notes, note 5).
Disclosures on ESRS E2 Pollution
Impacts, Risks and Opportunities Management
Disclosure Requirement Related to ESRS 2 IRO-1 – Description of the processes to identify and assess material pollution-related impacts, risks and opportunities
Fraport is committed to gaining a better understanding of its environmental impact, including air emissions, and to reducing this impact by taking efficient and responsible action. The issue of air pollution has already been considered relevant for a number of years. As part of the DMA, this issue was again analyzed and evaluated by environmental experts in a workshop at the Frankfurt site. The assessment of environmental aspects and the resulting risks and opportunities is based, among other things, on the results of the Eco-Management and Audit Scheme (EMAS) network. In the EMAS network, environmental aspects are continuously discussed and analyzed with the officers for waste, water protection, hazardous goods, radiation protection, and hazardous substances, as well as with the relevant departments. In 2024, alongside Fraport AG, the EMAS network included FCS Frankfurt Cargo Services GmbH (FCS) and NICE Aircraft Services & Support GmbH (NICE), as well as the subsidiaries Fraport Ground Services GmbH (FraGround) and FraCareServices GmbH (FraCareS).
The experts from these departments discussed and evaluated the potential and actual impacts, risks, and opportunities related to environmental pollution in accordance with ESRS 1 AR 16 in terms of the materiality of or for airport operations at the Frankfurt site and airport operations in general. The assessment was conducted for the foreign Group companies in collaboration with the Global Investment Management department at Fraport responsible for foreign sites, in particular those with flight operations (see disclosure requirement ESRS 2 IRO-1). The assessment included not just the operations at the airport, but also the ground-level flight operations. The activities of third parties in the value chain were also considered in this analysis.
Thereby the external stakeholders were addressed directly by means of a higher-level stakeholder survey on the importance of the topics. The central Fraport departments in Frankfurt regularly exchange information with the affected communities, in particular through formats and institutions such as the Aircraft Noise Commission, the Umwelt- und Nachbarschaftshaus, Hessenwasser (drinking water supply), and Darmstadt Regional Council. Representatives of these departments also participated in workshops as part of the DMA.
The only topic that was identified or evaluated as material for the Fraport Group and its value chain for the E2 Standard in the DMA was the pollution of air. Relevant sources are the combustion processes of fuels. In addition to activities on the apron, this includes emissions from ground-level air traffic. Because of the fundamental relevance for the aviation business model, Fraport is not initially excluding any site with flight operations from the materiality.
In addition to the established air pollutants listed below, the UFP (ultrafine particles) class of pollutants has gained in relevance at the Frankfurt site in recent years. UFP are solid or liquid air-borne particles with a diameter smaller than 100 nm. Unlike limit-controlled air pollutants, airports have proven to be a major source of UFP. Due to their small size, UFP are classified as potentially harmful to health, however, no reliable database exists to determine a dose-response relationship. The Hessian State Office for Nature Conservation, Environment and Geology (HLNUG) measurements have shown in the last few years that Frankfurt Airport clearly contributes to the UFP burden in the vicinity of the airport. The extent to which a location is affected by the emissions from the airport depends on the distance from the airport and the frequency with which the location is situated in the airport’s exhaust air due to the prevailing wind direction.
Disclosure Requirement E2-1 – Policies Related to Pollution
Fraport has implemented the reliable and efficient management of air pollutants at the Frankfurt site within the framework of EMAS in an environmental management system. EMAS is system for environmental management and audit scheme that companies can implement voluntarily. This audit is carried out by state-authorized environmental auditors. EMAS is considered to be the world’s most demanding environmental management system. Fraport AG has been validated by EMAS for over 25 years. For the Frankfurt site, it covers the network sites described above and also includes ground-level emissions caused by air traffic. Group Strategy and Development departement is responsible for the management system, and reports annually on the development to the Executive Board.
The environmental policy stated in accordance with EMAS includes the principle of developing strategies and policies with the aim of continuously improving the environmental performance of aviation. As an airport operator, Fraport can only indirectly influence emissions from aircraft. Direct control is only possible for the undertaking’s own vehicles, in particular the apron fleet, and equipment.
As air pollutants are produced as by-products of the combustion of hydrocarbon-based fuels, Fraport is pursuing two key levers to reduce their impact: the reduction or avoidance of fuel combustion and the promotion of less polluting combustion techniques. Actions to reduce fuel combustion are mainly focused on the undertaking’s own vehicle fleets, while the focus for the promotion of less polluting combustion techniques is on flight operations. Reducing the impact will benefit both airport workers and local residents. Monitoring is carried out for Frankfurt Airport within the scope of EMAS as described above. Further information on the measures can be found under disclosure requirement E2-2. The measures are managed as part of the decarbonization master plan (see disclosure requirement E1-1 and E2-2).
As part of EMAS, Fraport is working at Frankfurt Airport on the continuous improvement and ongoing optimization of the monitoring and modeling of emissions. Fraport is continuously working to record the air pollutant emissions of all relevant emitters through airport operations at the Frankfurt site on an annual basis in order to achieve a systematic inventory of air pollutant emissions. Air quality has been monitored at several sites at Frankfurt Airport since 2002. The selection of the pollutants to be observed depends on their relevance. They are especially important if they are recognized in a noticeable amount at Frankfurt Airport and are regulated by a threshold value, even if these threshold values only apply to residential areas. Under the leadership of the HLNUG, nitrogen oxides, carbon monoxide, ozone, particulate matter (PM10, PM2.5), hydrocarbons, UFP, and sulphur oxides are currently monitored at the Frankfurt site.
At present, the measures described here for the Frankfurt site are not yet a Group-wide policy. In November 2024, the Executive Board commissioned the Corporate Development and Sustainability and Finance and Investor Relations departments to develop a Group-wide management concept for the impact of “air pollutants” with the relevant departments.
Disclosure Requirement E2-2 – Actions and Resources Related to Pollution
Actions to Promote Lower-emission Combustion
In order to motivate airlines to use lower-emission aircraft, Fraport collects airport charges on nitrogen oxides and hydrocarbon at the Frankfurt site on an ongoing basis. Airlines pay the emissions-based fee per kilogram of nitrogen oxide equivalent emitted by an aircraft during takeoff and landing (“landing and take-off cycle,” LTO). Charges are levied per landing and per takeoff. The necessary information on aircraft and engine types is determined by way of a recognized fleet database.
Fraport publishes the quantities of pollutants emitted by the aircraft at the Frankfurt site in its annual environmental statement. In addition to modern turbines, fuel also plays an important role in the quality of combustion. Research has shown that sustainable aviation fuel burns more cleanly than fossil fuels. The planned increase in the use of these fuels should therefore also help to reduce the impact. Fraport is not involved in the direct value chain of aviation fuels, nor does it plan to be. The refueling infrastructure is operated by third parties. Nevertheless, Fraport is continuously working through its industry associations to promote the market ramp-up of alternative aviation fuels.
Actions to Reduce Combustion
In addition to flight operations, air pollutants are also generated at airports by the apron traffic and vehicle traffic. As a way of reducing pollutants, as described under disclosure requirement E1-3 as part of the “change energy sources” decarbonization lever, Fraport is gradually converting its fleet at Frankfurt Airport to low-emission and electric motors. Currently, several hundred vehicles in the fleet at Frankfurt Airport already have an electric motor. This action will be completed when the objective of the decarbonization master plan is achieved in 2045 at the latest.
As described under disclosure requirement E1-4 for Scope 3, Fraport is gaining initial experience in the reduction of combustion in flight operations with actions such as single-engine taxiing and reduced-engine taxiing out, as well as pre-conditioned air. However, this experience has not yet been incorporated into a comprehensive set of actions.
Actions for the Further Development of Emissions Monitoring and Modeling
In order to gain further knowledge on UFP, the Forum Flughafen und Region (Forum Airport and Region, FFR) has taken up the subject area in its work program at the request of the Hessian state government and will carry out a comprehensive study on ultrafine particles. A “UFP” working group has been set up at the Umwelt- und Nachbarschaftshaus (UNH), in which Fraport AG is also involved. The FFR has decided to commission a study to assess the exposure of the Rhine-Main region to UFP and its health effects in two main parts: a pollution study and an impact study. The contracting entity of the studies is UNH, which acts as an office of the FFR. The “SOURCE FFR (Study On Ultrafine Particles at the Frankfurt Airport Region) – measurement & modelling” UFP pollution study, commissioned by UNH, began in April 2023. Fraport AG is supporting the study project by conducting the measurements on the airport site and providing a variety of operating and activity data for emissions modeling of sources related to the airport. The pollution study is expected to be completed in fall 2026. The results should form the basis for the impact study on the possible health effects of UFP, to be carried out at a later date. In parallel to the pollution study, a Europe-wide invitation to tender for a secondary data-based cohort study and a panel study for adults (study duration approximately 3-5 years) is currently underway. The contract is expected to be awarded in the first quarter of 2025. The results should provide an indication of the dose-response relationship. A better understanding of this relationship forms the basis for introducing targeted measures that establish an acceptable balance between the negative and positive effects of air traffic. Information regarding the way in which questions concerning the survey and the effect of UFP in the region around the airport will be handled and how this issue will be addressed by the FFR is published on the UNH web pages and can be viewed at https://www.ultrafeinstaub-studie.de/en/.
Frankfurt Airport is continuously working on improving the emissions inventory and the modeling of the site, including flight operations, in order to be able to map the actions described to reduce the impact (see also disclosure requirement E2-1).
Fraport intends to develop standardized Group-wide parameters and methods for assessing air pollutants in accordance with the ESRS. Until further notice, the Group airports will record qualitatively whether there have been deviations from local operating regulations or complaints from the supervisory authorities regarding air pollution. At the Greek regional airports of Thessaloniki, Corfu and Rhodes, air quality is also monitored on an ongoing basis using measuring technology. In the event of deviations, it is the responsibility of local management to take corrective action in consultation with the affected stakeholders. No deviations from the applicable national or local requirements in the context of air pollutants were reported by the international Group airports in the reporting year.
Metrics and Targets
Disclosure Requirement E2-3 – Targets Related to Pollution
Fraport has two measurable, outcome-oriented, and time-bound sub-targets:
- Further development of models for measuring air pollutants
- Support for the UFP study
These sub-targets are consistent with the main qualitative target of gaining a deeper understanding of the emission of air pollutants (emissions) by the airport and their impact on people and the environment. On this basis, differentiated information is available to assess the air pollution situation and can be used both to derive further actions and provide transparent communication.
To date, Fraport has not set any outcome-oriented reduction targets for air pollutants based on metrics. As explained, the causes of greenhouse gas and air pollutant emissions are closely linked. The reduction of direct air pollutant emissions in operational processes is currently adequately addressed indirectly by the decarbonisation levers and targets described in section E1.
Air pollutant emissions from flight operations are addressed on an ongoing basis at the largest Fraport site through the collection of emissions-specific airport charges and are monitored as part of the EMAS certification and assessed annually by third parties. The core principle of EMAS is based on the continuous improvement of environmental performance, including the reduction of specific air pollutant emissions, which is also reported annually in the EMAS site network’s environmental statement.