Asset and Financial Position
Asset and Capital Structure
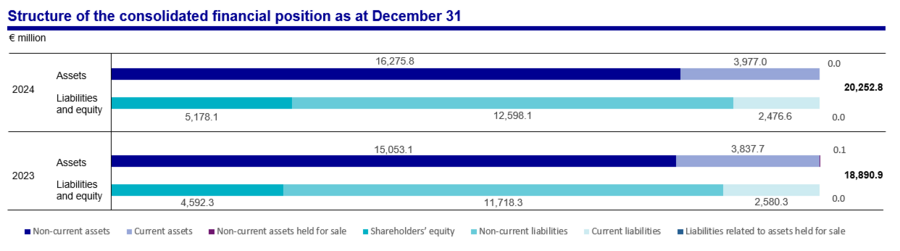
At €20,252.8 million, total assets as at December 31, 2024 were €1,361.9 million (+7.2%) above the previous year.
Non-current assets increased by €1,222.7 million to €16,275.8 million. This is primarily attributable to the increase in property, plant, and equipment (+€898.8 million) in connection with capital expenditure at the Frankfurt site. Investments in airport operating projects also increased by €400.7 million as a result of the ongoing expansion at the Group company in Lima in particular. Other financial assets decreased by €118.8 million due to reclassifications based on maturity, which were offset by lower additions to securities as well as investments in promissory note loans.
At €3,977.0 million, current assets were €139.3 million above the comparable value as at December 31, 2023. This is mainly due to an increase in cash and cash equivalents of €235.7 million and higher non-financial receivables and assets (+€60.3 million) due to the balance sheet date. In contrast, other current financial assets decreased by €167.2 million. The above-mentioned reclassifications based on maturity and other additions to securities were offset by higher scheduled disposals.
At €5,178.1 million, shareholders’ equity as at the 2024 balance sheet date was €585.8 million higher than on December 31, 2023. The increase resulted, in particular, from the positive Group result of €501.9 million. The shareholders’ equity ratio increased by 23.8% compared to previous year (December 31, 2023: 22.9%).
Non-current liabilities increased by €879.8 million to €12,598.1 million (+7.5%). The increase is mainly due to the increase in financial liabilities due to the bond issue in the second quarter of 2024 and the addition of further non-current financial liabilities by Fraport AG and the Group company Lima (+€764.3 million). These were offset in particular by maturity-related reclassifications to current financial liabilities. Current liabilities decreased in the reporting period by €103.7 million to €2,476.6 million. This is mainly due to the decrease in current financial liabilities (–€193.1 million) resulting primarily from the repayment of an existing bond. This decrease was offset by maturity-related reclassifications of previous non-current financial liabilities. In addition, trade accounts payable increased by €57.7 million to €488.5 million due to the balance sheet date.
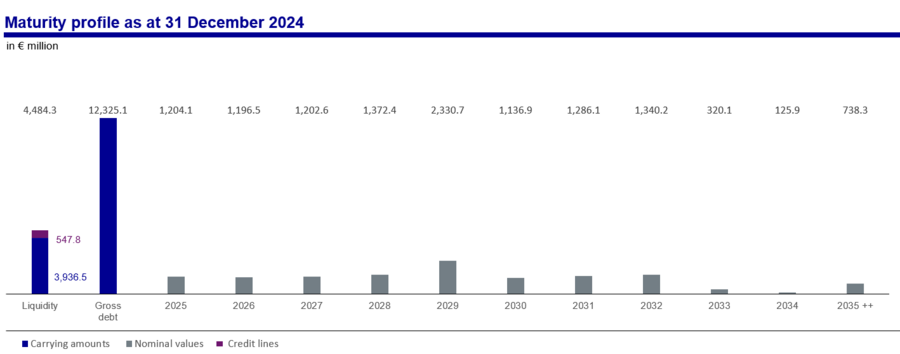
Gross debt as at December 31, 2024 was €12,325.1 million, up €571.2 million from €11,753.9 million as at December 31, 2023. Group liquidity as at the balance sheet date consisted of cash and cash equivalents of €2,646.2 million and other financial assets of €1,290.4 million. In total, this figure was €3,936.6 million, down €104.7 million compared to the previous year. Correspondingly, net financial debt increased by €675.9 million to €8,388.5 million (December 31, 2023: €7,712.6 million). The gearing ratio reached a level of 173.7% (value as at December 31, 2023: 178.6%). The net financial debt to EBITDA ratio reached a level of 6.4 (previous year: 6.4).
Additions to Non-Current Assets
In the 2024 fiscal year, the additions to non-current assets of the Fraport Group totaled €1,845.8 million, €344.1 million more than the previous year (previous year: €1,501.7 million). They related to €1,281.3 million in property, plant and equipment (previous year: €955.8 million) and €546.7 million (previous year: €536.9 million) in capital expenditure in “airport operating projects.” The item “Other intangible assets” accounted for €15.8 million (previous year: €7.7 million), and “Investment property” for €2.0 million (previous year: €1.3 million). The capitalization of interest expenses relating to construction work amounted to €121.4 million (previous year: €71.0 million).
At Fraport AG, the additions to non-current assets amounted to €1,276.5 million (previous year: €935.6 million). Capital expenditure was mostly attributed to the Expansion South project at the Frankfurt site – mainly relating to Terminal 3 and the passenger transport system – as well as modernization and maintenance measures for existing infrastructure.
In the 2025 fiscal year, additions to assets will also be primarily characterized by multi-year capital expenditure for the capacity expansion in Frankfurt.
The additions to non-current assets are attributed to the individual segments as follows:
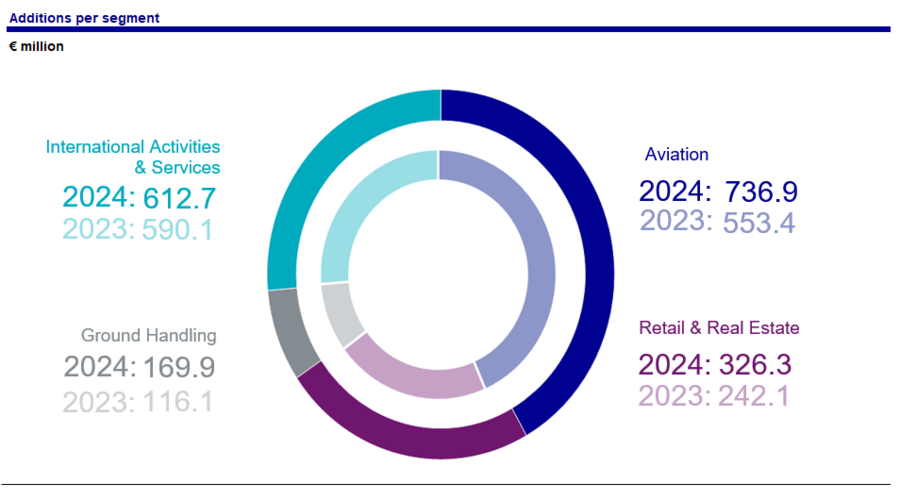
Capital expenditure in the Aviation segment amounting to €736.9 million (previous year: €553.4 million) primarily concerned the ongoing construction work in connection with the Frankfurt Airport Expansion South project. Most of this amount related to Terminal 3 and the passenger transport system.
In the 2024 fiscal year, the Retail & Real Estate segment recorded additions to assets in the amount of €326.3 million (previous year: €242.1 million). The measures also concerned, in particular, the Expansion South project.
The Ground Handling segment recorded additions amounting to €169.9 million (previous year: €116.1 million). These mainly included the modernization measures for existing facilities as well as capital expenditure in connection with the Expansion South project.
In the International Activities & Services segment, additions to non-current assets amounted to €612.7 million (previous year: €590.1 million). The additions related mainly to the Group company Lima in connection with the infrastructure expansion.
Statement of Cash Flows
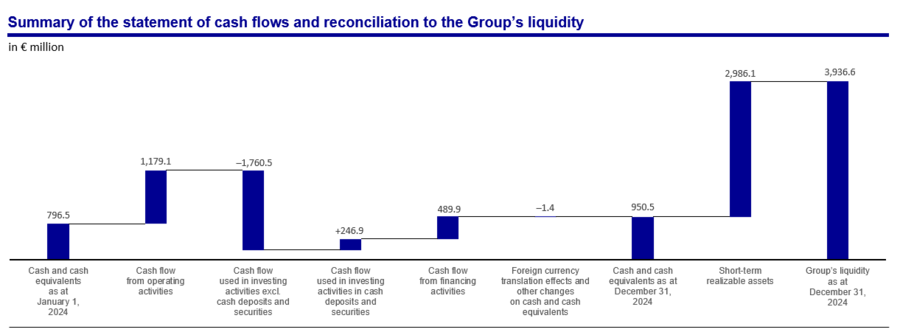
In the 2024 fiscal year, cash flow from operating activities (operating cash flow) of €1,179.1 million (2023: €863.2 million) was generated. The improvement of €315.9 million compared to the previous year was mainly due to the improved operating result, positive effects arising from the change in working capital, and an increased balance from incoming and outgoing interest payments.
Cash flow used in investing activities without investments in cash deposits and securities amounted to €1,760.5 million in the past fiscal year, an increase of €277.9 million year on year. The increase was primarily the result of higher capital expenditure in airport operating projects, particularly in Lima, as well as increased cash outflows for expansion measures at the Frankfurt site. Considering investments in and revenue from securities, promissory note loans, and time deposits, the overall cash flow used in investing activities was €1,513.6 million (2023: €1,818.9 million).
Compared to the previous year, cash flow used in financing activities decreased by €305.5 million to €489.9 million. Cash inflows from long-term financial liabilities were particularly affected by the bond issue in the second quarter of 2024. By contrast, the redemption of the existing bond had a considerable impact on the repayment of the long-term financial liabilities. Other substantial funds raised relate to project financing at the Group company Lima. The capital increases “Non-controlling interests” relate to capital contributions to the group company in Lima. Taking into account exchange rate fluctuations and other changes, the Fraport Group reported cash and cash equivalents based on the consolidated statement of cash flows of €950.5 million as at December 31, 2024 (2023: €796.5 million).
Free cash flow amounted to –€674.7 million (2023: –€656.4 million).
The following table shows a reconciliation to cash and cash equivalents as shown in the consolidated statement of financial position.
| Reconciliation to the cash and cash equivalents as at the consolidated statement of financial position | ||
|---|---|---|
| in € million | December 31, 2024 | December 31, 2023 |
| Bank and cash balances | 177.6 | 290.4 |
| Time deposits with a remaining term of less than three months at the time of acquisition | 772.9 | 506.1 |
| Cash and cash equivalents as at the consolidated statement of cash flows | 950.5 | 796.5 |
| Time deposits with a remaining term of more than three months at the time of acquisition | 1,695.7 | 1,614.0 |
| Cash and cash equivalents as at the consolidated statement of financial position | 2,646.2 | 2,410.5 |
Financing Analysis
In 2024, the finance management of the Fraport Group continued to pursue balanced funding via a diversified debt financing base with a balanced maturity profile. As at the balance sheet date, there was a balanced mix of financing, consisting of promissory note loans (20.7%), corporate bonds (17.1%), bilateral loans (42.9%), and project financing (19.3%).
To reduce interest rate risks from borrowing with floating interest rates, in the past interest rate hedging transactions were concluded in some cases. In the course of the project financing in Lima, interest rate hedging derivatives were concluded in 2023 in order to reduce the interest rate risk from project financing. The related nominal volume amounted to €797.7 million as at year-end (previous year: €530.7 million). Overall, the financial liabilities had an average remaining term of 5.9 years with an average interest maturity of approximately 4.8 years after hedging measures. Taking into account interest rate hedging transactions, the floating rate portion of the gross debt of the Fraport Group was approximately 17%, and the fixed portion approximately 83%. The cost of debt after hedging measures was 3.2%.
Fully consolidated Group companies in Germany are mostly integrated into the Fraport AG cash pool, so that acquiring separate external funding was not necessary. In the 2024 fiscal year, funding for fully consolidated foreign Group companies was obtained through project financing agreements, partly in conjunction with the additional contribution of shareholders’ equity. No analysis or calculation of the financial debt structure and liquidity at segment level is carried out.
The key features of the Group financing instruments with regard to type, maturity, and interest rate structures are presented in the following table:
| Financial debt structure | ||||||
|---|---|---|---|---|---|---|
| Financing type | Year of origin |
Nominal volume in € million |
Maturity |
Repayment structure |
Interest |
Interest rate |
| Promissory note loans | 2012 – 2024 | 2,539.5 | 2025 – 2037 | End of term | Fixed | 0.5 % – 5.084 % p. a. |
| Floating | 6M-Euribor + Margin | |||||
| Corporate bond | 2009 – 2024 | 2,100.0 | 2027 – 2032 | End of term | Fixed | 1.875 % – 5.875 % p.a. |
| Bilateral loans | 1999 – 2024 | 5,252.3 | 2025 – 2032 | Mainly end of term | Mainly fixed | 0.378 % – 5.06 % p. a. |
| Project financing (fully consolidated foreign Group companies) |
2017 – 2024 | 2,362.0 | 2025 – 2045 | Ongoing repayments during the term | Fixed and Floating | 4.49 % – 10.56 % p. a. |
The contractual agreements for the financial liabilities of Fraport AG include two non-financial covenants, for example, in the form of a negative pledge and a pari passu clause. Only the special-purpose bilateral loans of Fraport AG contain additional covenants.
Independent project financing agreements of fully consolidated foreign Group companies, in particular in Peru, Greece, and Brazil, contain a series of credit clauses typical for this type of financing. These clauses include regulations under which certain debt service coverage ratios and control indicators for leverage and credit terms must be complied with. Failure to comply with the agreed credit clauses may lead to restrictions on the distribution of dividends and/or to the early redemption of loans or to the additional payment of shareholders’ equity.
The maturity profile of the financial debt of the Fraport Group showed a largely balanced repayment structure as at the balance sheet date (financial debt in foreign currencies translated as at the balance sheet date rate).
Liquidity Analysis
The strategy of broad diversification of investments in corporate bonds was continued in the 2024 fiscal year. The key characteristics of the investment instruments of Fraport AG in terms of type, remaining term, and interest rate structure are presented in the following table:
| Asset structure of Fraport AG | |||
|---|---|---|---|
| Investment type | Market value1) in € million |
Average remaining term in years |
Interest |
| Promissory note loans | 273.5 | 1.3 | Fixed |
| Time deposits | 1,685.0 | 0.5 | Fixed |
| Bonds | 73.1 | 1.5 | Floating |
| 814.7 | 1.0 | Fixed | |
| thereof financials | 73.1 | 1.5 | Floating |
| 270.2 | 1.5 | Fixed | |
| thereof insurances | 0.0 | 0.0 | Floating |
| 14.7 | 1.0 | Fixed | |
| thereof industrials | 529.9 | 1.0 | Fixed |
| Commercial papers | 128.9 | 0.3 | Fixed |
| 1) As a result of rounding, there may be discrepancies when summing up. | |||
The ratings of all investments used in asset management are presented in the following diagram.
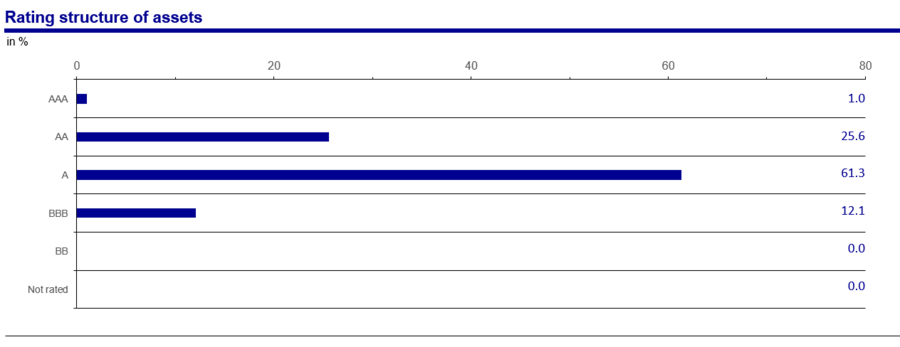
As at the balance sheet date, there were only rated assets in the portfolio.
The cost of carry, which is calculated using a (tiered statement) maturity-matching principle, was –1.0% (–€31.1 million) as at December 31, 2024.
Liquidity in the fully consolidated Group companies was €945.2 million (previous year: €780.7 million). As it is partly subject to drawing restrictions arising from the contractual agreements, it is not part of the asset management at Fraport AG.
As at the 2024 balance sheet date, the Fraport Group had unused credit lines amounting to €547.8 million (previous year: €958.6 million) available, of which €211.9 million were, however, earmarked for future capital expenditure on infrastructure. As at the balance sheet date, Fraport AG had unused credit lines amounting to €335.9 million (previous year: €489.2 million).
Significance of Off-Balance-Sheet Financial Instruments for the Financial Position
Fraport focuses on the products presented in the “Financing analysis” section for financing its activities. Off-balance-sheet financial instruments are of no material significance in the financing mix of Fraport.
Rating
In light of the unrestricted access of Fraport to the capital market, very healthy liquidity supply combined with its portfolio of free, approved credit lines, there has not been a need for an external rating so far.
| Comparison with the forecasted development | |||||
|---|---|---|---|---|---|
| 2024 | Forecast 2023 [Adjustments during the year 2024] |
2023 | Change | Change in % | |
| Free cash flow (€ million) | –674.7 | Negative in the mid three-digit million € range | –656.4 | –18.3 | –2.8 |
| Net financial debt to EBITDA |
6.4 | Roughly at level of 2023 | 6.4 | 0.0 | – |
| Group liquidity (€ million) | 3,936.6 | Below level of 2023 | 4,041.3 | –104.7 | –2.6 |
The key figures of the asset and financial position were in line with the forecast for the 2024 fiscal year.
Development of the Value Added
| € million | Fraport Group | Aviation | Retail & Real Estate | Ground Handling | International Activities & Services | |||||
| 2024 | 2023 | 2024 | 2023 | 2024 | 2023 | 2024 | 2023 | 2024 | 2023 | |
| Adjusted EBIT1) | 885.9 | 822.9 | 207.3 | 155.2 | 272.8 | 273.3 | –78.8 | –73.8 | 484.6 | 468.2 |
| Fraport assets | 13,988.8 | 12,477.7 | 5,224.7 | 4,664.1 | 3,109.7 | 2,893.5 | 1,080.3 | 953.2 | 4,574.1 | 3,966.9 |
| Costs of capital before taxes | 1,119.1 | 948.3 | 418.0 | 354.5 | 248.8 | 219.9 | 86.4 | 72.4 | 365.9 | 301.5 |
| Value added before taxes | –233.3 | –125.4 | –210.8 | –199.2 | 24.0 | 53.4 | –165.2 | –146.2 | 118.7 | 166.7 |
| ROFRA in % | 6.3 | 6.6 | 4.0 | 3.3 | 8.8 | 9.4 | –7.3 | –7.7 | 10.6 | 11.8 |
| 1) Adjusted EBIT = EBIT + earnings before taxes of the Group companies accounted for using the equity method. | ||||||||||
In the 2024 fiscal year, the value added of the Fraport Group decreased by €107.9 million to –€233.3 million (previous year: –€125.4 million) and remains in a negative range.
The positive traffic development in the Group primarily contributed to an improvement of €63.0 million in adjusted EBIT to €885.9 million (previous year: €822.9 million). The higher capital expenditure, particularly in the development projects in Frankfurt and Lima, as well as the increase in WACC from 7.6% to 8.0% had an opposite effect and resulted in higher capital costs.
Due to higher capital expenditure, the ROFRA of the Fraport Group decreased by 0.3 percentage points to 6.3% (previous year: 6.6%).
The value added of the Aviation segment will continue to be determined by the progress of construction activities as part of the Expansion South project and the increase in capital costs. Despite the positive operating development, this fell by –€11.6 million to –€210.8 million (previous year: –€199.2 million). Segment ROFRA improved from 3.3% to 4.0%.
In the Retail & Real Estate segment, higher Fraport assets in the course of the expansion project in Frankfurt resulted in a decrease in the value added from €53.4 million to €24.0 million (–€29.4 million) and of ROFRA to 8.8% (previous year: 9.4%).
The value added of the Ground Handling segment decreased to –€165.2 million (previous year: –€146.2 million), mainly due to the increase in capital costs. Segment ROFRA improved to –7.3% (previous year: -7.7%).
The value added of the International Activities & Services segment decreased from €166.7 million to €118.7 million (–€48 million). This was mainly due to an increase in capital expenditure for the expansion at Lima Airport. In line with the value added, segment ROFRA decreased from 11.8% to 10.6%.
| Comparison with the forecasted development | |||||
|---|---|---|---|---|---|
| 2024 | Forecast 2023 | 2023 | Change | Change in % | |
| Group ROFRA (%) | 6.3 | Roughly at the level of 2023 or slightly above | 6.6 | –0.3 PP | – |
Despite the positive operating result, Group ROFRA was slightly below the forecast for the 2024 fiscal year at 6.3%.