Control system
The “Control System” chapter explains the key indicators used by the Executive Board to make the corporate measures taken as part of the Group strategy measurable and to evaluate them.
Changes Compared with the Previous Year
The following changes were made to the Group’s control system in the 2024 fiscal year. Consistent with the new Group strategy Fraport.2030, the number of key financial performance indicators was reduced compared to the previous year by removing Group liquidity and net financial debt to EBITDA ratio. These key figures continue to be listed as important financial key figures and reflect the financial stability of the company. There have been no other changes to the financial key figures at Fraport Group and Fraport AG level.
In parallel to this, the Executive Board dealt with the requirements of the Corporate Sustainability Reporting Directive (CSRD). In this context and in the course of the adoption of the new Group strategy, the number of passengers, global passenger satisfaction, and employee satisfaction in the Group and at Fraport AG were defined as important strategic non-financial key figures.
Beginning with the reporting for the 2024 fiscal year, the Executive Board will focus on the following financial performance indicators, the developments of which are presented in the “Results of Operations,” “Asset and Financial Position,” and “Value Management” chapters. Corresponding forecasts for the key financial performance indicators have been stated in the “Business Outlook” chapter.
Financial Performance Indicators
| Overview financial key performance indicators | ||||
|---|---|---|---|---|
| Key figure | Scope | Value 2024 | Terms | |
| 2025 | 2030 | |||
| EBITDA (€ million) |
Group | 1,301.8 | Moderate single-digit percentage growth | 2,000 |
| Free Cash Flow (€ million) |
Group | -674.7 | Improvement in the mid three-digit million range - close to break-even |
1,000 |
| Group Profit | Group | 501.9 | Previous year's level or slightly below | – |
| ROFRA | Group | 6.3 | Previous year's level | long-term >WACC |
| Net profit (€ million) | Fraport AG | 343.5 | Up to 400 € million | long-term |
| Liquidity (€ million) |
Fraport AG | 2,998.9 | >1 € billion, at previous year's level | long-term |
For Fraport, the growth-oriented development of financial performance indicators is critical for the long-term success of the company. Their overriding importance is reflected in the Group strategy. Control, derived from the Group strategy, is carried out primarily at the Group level, and segment-specific key figures are used to aid the process.
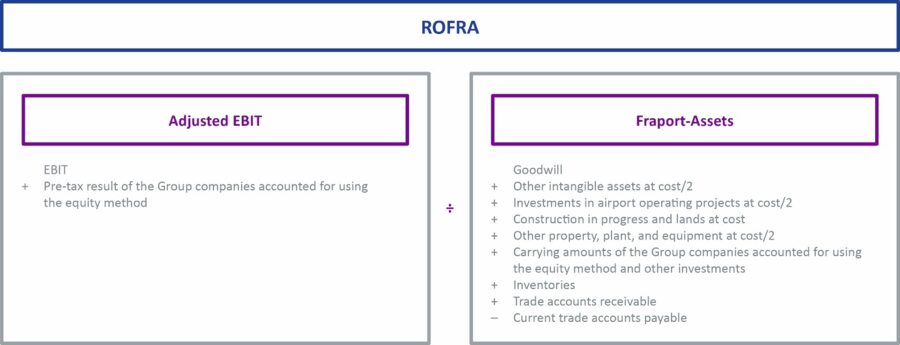
Fraport uses the key figures EBITDA, Group result, free cash flow, and return on Fraport assets (ROFRA) as key financial performance indicators. EBITDA and ROFRA are also direct components of the Executive Board remuneration and underline the relevance of these financial key figures as control elements.
EBITDA represents the operating performance of the company. It is defined as operating earnings before interest, taxes, and depreciation and amortization. The Group result is the Group result after tax. Free cash flow is the result of the cash flow from operating activities less the effects resulting from the application of IFRS 16, investments in airport operating projects, capital expenditure for other intangible assets, capital expenditure in property, plant, and equipment, investments for “investment property” and capital expenditure in companies accounted for using the equity method, plus “dividends from companies accounted for using the equity method.” The free cash flow provides information about the financial funds available to the Group from the operating activities of a period after deducting operating capital expenditure activities. These free funds can be retained in order to increase the company’s liquidity and to be available as a financial reserve for future capital expenditure or to reduce the leverage (the gearing ratio) and/or can be distributed among shareholders as dividends. Due to the ongoing capital expenditure for expansion activities in Frankfurt and internationally, the free cash flow continues to be extraordinarily burdened and temporarily negative. Following the completion of the major construction measures in Frankfurt (Terminal 3) and the construction of the new terminal in Lima, the aim is to achieve a clear increase in free cash flow in positive territory.
The ROFRA is calculated on the basis of the EBIT extended by the results before taxes of the Group companies accounted for using the equity method divided by the Fraport assets. The Fraport assets are defined as the average of the fixed interest-bearing capital of the Group or segments required for operations including the carrying amounts of the Group companies accounted for using the equity method. To avoid economic enhancement coming solely from depreciation and amortization of assets, the Executive Board recognizes regularly depreciable or amortizable assets within Fraport assets at half of their historical acquisition/manufacturing costs (at cost/2), and not at residual carrying amounts. Goodwill and investments in Group companies accounted for using the equity method and other assets not included in depreciation and amortization, in particular assets in construction, are recognized in full at acquisition/manufacturing costs because they are not subject to regular depreciation and amortization. Within the scope of the initial implementation of IFRS 16, other property, plant, and equipment also includes the rights to use resulting from leasing contracts. They are included in the calculation at half acquisition/manufacturing costs.
At Fraport AG level, net income is a key figure of significance for determining the distribution potential. The liquidity of Fraport AG is also relevant for management. Against the background of the capital-intensive expansion at the Frankfurt site and the international business as well as the temporarily high net financial debt, the Executive Board is aiming for minimum liquidity that is well above €1 billion.
Important financial key figures
Fraport uses key figures relating to the consolidated results of operations and the Group asset and financial position, as well as key figures that link the results of operations with the asset and financial position (value management), as further financial performance indicators. These indicators are managed in accordance with the long-term oriented Group strategy and are assessed by the Executive Board taking into account the long-term forecasted market developments. In this context, strategic measures – such as the implementation of larger capital expenditure projects or the expansion of international business – can also lead to a short- to medium-term burden on the financial performance indicators.
| Overview of key financial figures | ||||
|---|---|---|---|---|
| Key figure | Scope | Value 2024 | Term | Target level |
| Group liqudity | Group | 3,936.6 | Long term | > €1 billion, temporarily clearly higher |
| Net financial debt to EBITDA | Group | 6.4 | Long term | Max. 5x |
Asset and financial position key figures
As well as in the results of operations, the result of the strategically adopted measures and operating activities of Fraport is also reflected in the Group’s asset and financial position. For Fraport, in particular the development of the net financial debt to EBITDA ratio and the Group liquidity are significant.
Group liquidity includes cash and cash equivalents (as at the statement of financial position) plus short-term realizable items in “other financial assets.” This key figure provides information on the financial stability of the Fraport Group, even over a long period of time. The Executive Board aims for liquidity of at least €1 billion in the long term. Against the backdrop of the current macroeconomic volatilities, the high level of debt related to the pandemic, and ongoing expansion activities, a temporarily substantially higher level of liquidity is being maintained.
The net financial debt to EBITDA ratio provides information on the financial stability of the company and how many years are required to service the net financial debt via EBITDA. Net financial debt consists of long-term and short-term financial liabilities less Group liquidity. The Executive Board has decided on a ratio of a maximum of five for this key figure and is resolved to reach this target value again in the medium term once the expansion activities have been completed.
Links between the results of operations and the asset and financial position (value management)
To increase the Group’s value in the long term, the Executive Board specifically draws parallels between the development of the results of operations and the asset and financial position. In this context, the Executive Board plans and manages the Group’s development according to the principles of value management.
In addition to the aforementioned ROFRA, Fraport uses the value added as a measure of economic enhancement. The value added is annually consolidated and recorded at Group and at segment level. It is calculated from the “adjusted” EBIT, which also includes the results before taxes of the Group companies accounted for using the equity method, minus the Fraport assets multiplied by the WACC.

The goal is to generate value added of zero for the regulated Aviation segment, and generate clearly positive values added for the other segments.
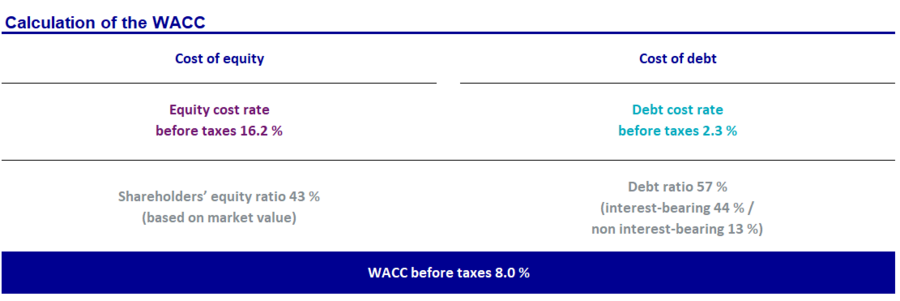
Fraport calculates the weighted average cost of capital (WACC) using the capital asset pricing model and uses this regulatory specific WACC to calculate its airport charges. Given the continuously changing economic environment, interest rate levels, and/or the risk and financing structure of Fraport, Fraport regularly reviews, and, if needed, adjusts its WACC. The WACC is also used for the value management of the Fraport Group. The WACC for the fiscal year increased compared to the previous year to 8.0% (before taxes, 2023: 7.6%).
The regulatory WACC is composed as follows:
The KPI developments in the past fiscal year are described in the “Results of Operations” chapter. The other financial key figures can be found in the “Asset and Financial Position” and “Value Management” chapters. The forecasted figures for the 2025 fiscal year can be found in the “Business Outlook” chapter. Definitions for calculating the financial key figures can be found in the “Glossary” chapter.
Strategic non-financial key figures
Within the framework of the Fraport.2030 strategy, the following important strategic non-financial key figures are used to measure performance:
| Overview strategic non-financial performance indicators | ||||
|---|---|---|---|---|
| Key figure | Scope | Value 2024 | Terms | |
| 2025 | 2030 | |||
| Number of passengers (million) | Group | 136.4 | – | 187 |
| Global satisfaction of passengers (%) | Group | 77 | 85 | 85 |
| Employee satisfaction | Group | 5.0 | 5 | 5 |
| Number of passengers (million) | Fraport AG | 61.6 | up to 64 million | – |
| Global satisfaction of passengers (%) | Fraport AG | 70 | 80 | 85 |
| Employee satisfaction | Fraport AG | 4.8 | > 4.8 and at least 0.1 better than 2024 | 5 |
| 1) Number of passengers excluding passengers at Antalya Airport | ||||
The growth in traffic is largely dependent on the development of passenger numbers at Group airports. Personnel planning, the operation of airport facilities, and the allocation of resources depend on this figure, which is used as a control parameter. The number of passengers is collected at the respective sites, and systematically recorded and consolidated.
Global satisfaction describes passengers’ satisfaction with the services and processes offered and the service at Fraport’s airports. It is collected as part of continuous passenger surveys at fully consolidated Group airports. The Group global satisfaction indicator is the weighted average of the global satisfaction in Frankfurt and at the fully consolidated international airports. As part of the Group strategy Fraport.2030, a target value of 85% has been set.
Employee satisfaction is a central instrument for measuring employee mood. Fraport is convinced that satisfied employees achieve higher customer loyalty and improved performance. From 2024, the key figure is measured annually on the basis of an extensive survey of the employees of Fraport AG and the fully consolidated Group companies. All labor-intensive Group companies in Frankfurt and the Group companies in Greece, Slovenia, Bulgaria, Peru, Brazil, and the USA participate in the survey. The results obtained from this provide the basis for long-term goal setting. The goal is to continuously improve employee satisfaction. In 2030, the Group is aiming for a figure of 5.0.
The key figures for global passenger satisfaction and employee satisfaction are published once a year in the annual report. This is because the respective data collection processes are started in the summer and fall, so half-year reporting is not possible.
Finance Management
The core objectives of finance management are securing liquidity, limiting financial risks, achieving an appropriate level of profitability, and ensuring flexibility. The highest priority is to secure liquidity. Based on the Group’s solid shareholders’ equity base, this is generally secured through both internal financing via operating cash flow and external financing in the form of debt. Simple and transparent financing concepts are being pursued in connection with how financing is structured at Fraport AG as well as in the international business activities. Financial risks caused, among other things, by foreign currencies are met first and foremost by financing in the respective currency to the extent possible (natural hedging). The following section shows how finance management is implemented at Fraport AG.
To secure liquidity, Fraport AG aims to achieve balanced financing composed of bilateral loans, private placements/corporate bonds (capital market), and promissory note loans. In addition, Fraport AG has a strategic liquidity reserve to secure its independence from financing sources. The significant financing measures at Fraport AG are related mainly to refinancing existing financial maturities, and from the capital requirement, particularly for capital expenditure in Terminal 3 at the Frankfurt site and for the international Group companies. Appropriate financing instruments are selected based on the situation, depending on the attractiveness of the price as well as the volume of the financing, and complying with a balanced financing mix. In keeping with the long-term nature of capital expenditure, the financing of these projects is mostly long term as well. In line with the company’s finance policy, loans can be borrowed both at a fixed and at a floating interest rate. To reduce interest rate risks from borrowing with floating interest rates, interest rate hedging transactions can be concluded as a rule.
The majority of the fully consolidated Group companies in Germany are integrated into the Fraport AG cash pool. The liquidity in these Group companies is guaranteed – via access to their own liquidity at any time as well as, within the scope of the agreements also concluded in some cases, to the financial resources of Fraport AG – so that external financing is not necessary. At the same time, the close connection of these Group companies to Fraport AG should also ensure that attention is paid to further strategic objectives of financial management within the Group.
For the fully consolidated foreign Group companies and the Group companies included using the equity method, liquidity is provided depending on the relevant company shareholding and the market environment, either by concluding project financing, bilateral loans, or by internal provision of funding via a Group loan or shareholders’ equity.